
Delta Read · Week of July 13, 2026 — Four Days of Red, Then Friday Cut the Floor
Get the Delta Reads
Our weekly order-flow read on MES and MNQ — what the tape did, and the levels we're watching next. One email a week. No noise.
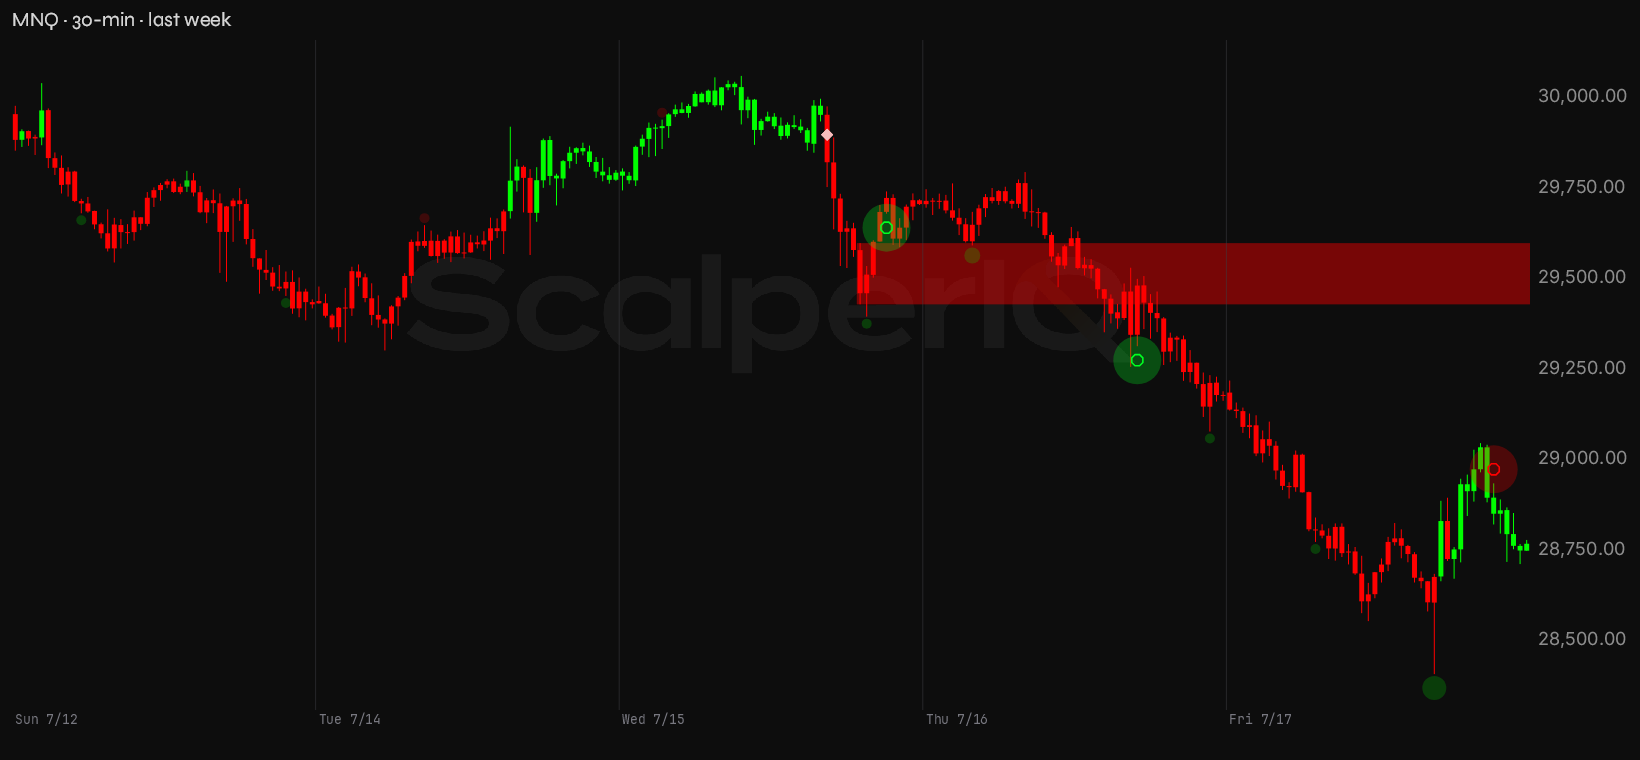
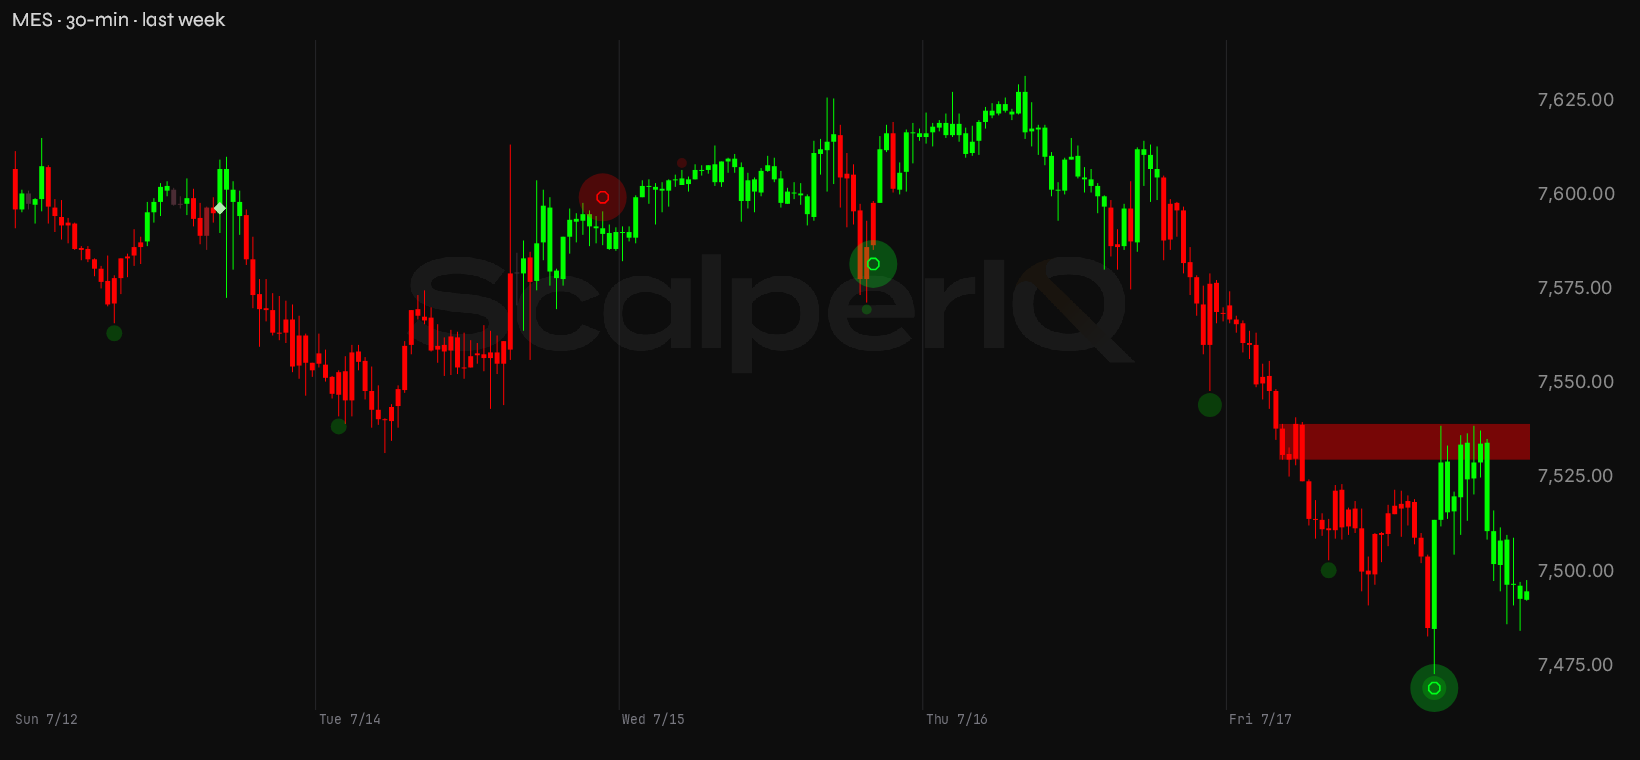
Both instruments came into the week leaning neutral, and both got resolved in the same direction. The week of July 6 closed with delta on the buy side — MNQ +9,859, MES +23,863. This week they printed −50,203 and −21,553. That is a clean flip in polarity, not a drift, and price went with it: MNQ tagged a new high at 30,062.50 on Wednesday, sold it, and never got back. Every bid shelf from the July 6 read broke on the way down, and MNQ's line in the sand at 28,910.25 was gone by Friday's close. MES held its line — 7,468.25 never quite gave way — and that's about the only thing on the bull side of the ledger.
MNQ closed the week at 28,768.75, down from 30,069.00 the prior Friday — a 1,300-point drop in five sessions, with most of the damage front-loaded on Monday and back-loaded on Friday. The week's range was 1,654.25 points. MES closed at 7,495.00, off from 7,626.00, range 159 points. The quick version: sellers ran the show all week, delta confirmed the move, and both instruments are sitting near their weekly lows heading into the week of July 20.
July Has Been Two Markets in One Delta Story
Month-to-date, MNQ and MES are telling a split story that's worth sitting with before you look at any single session.
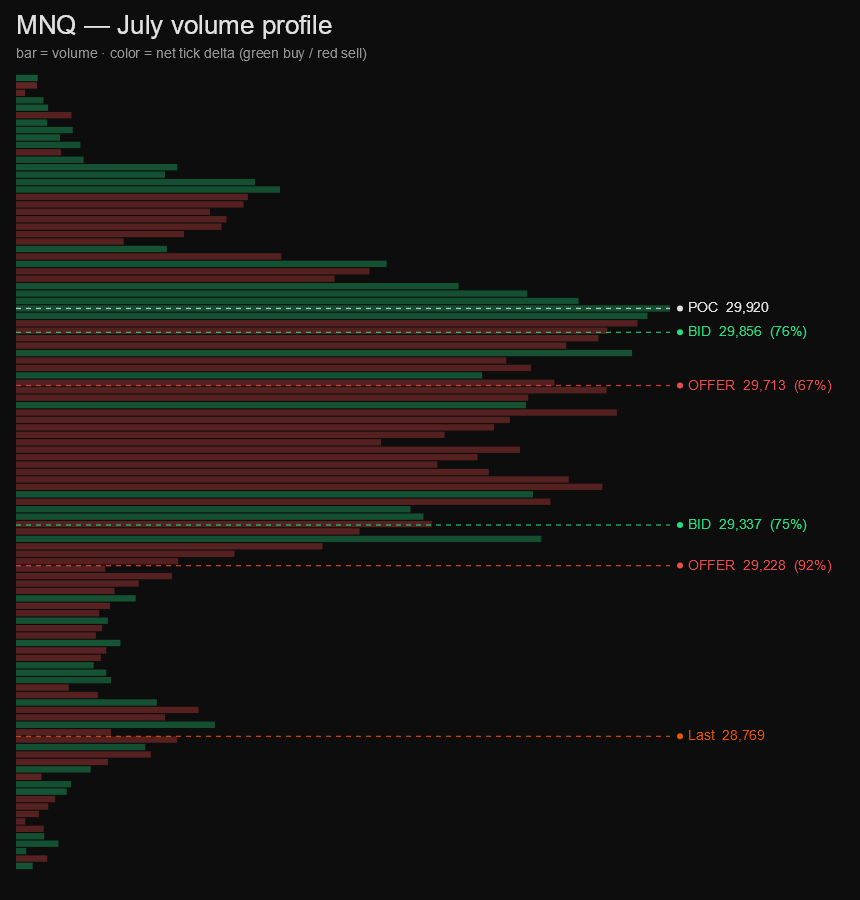
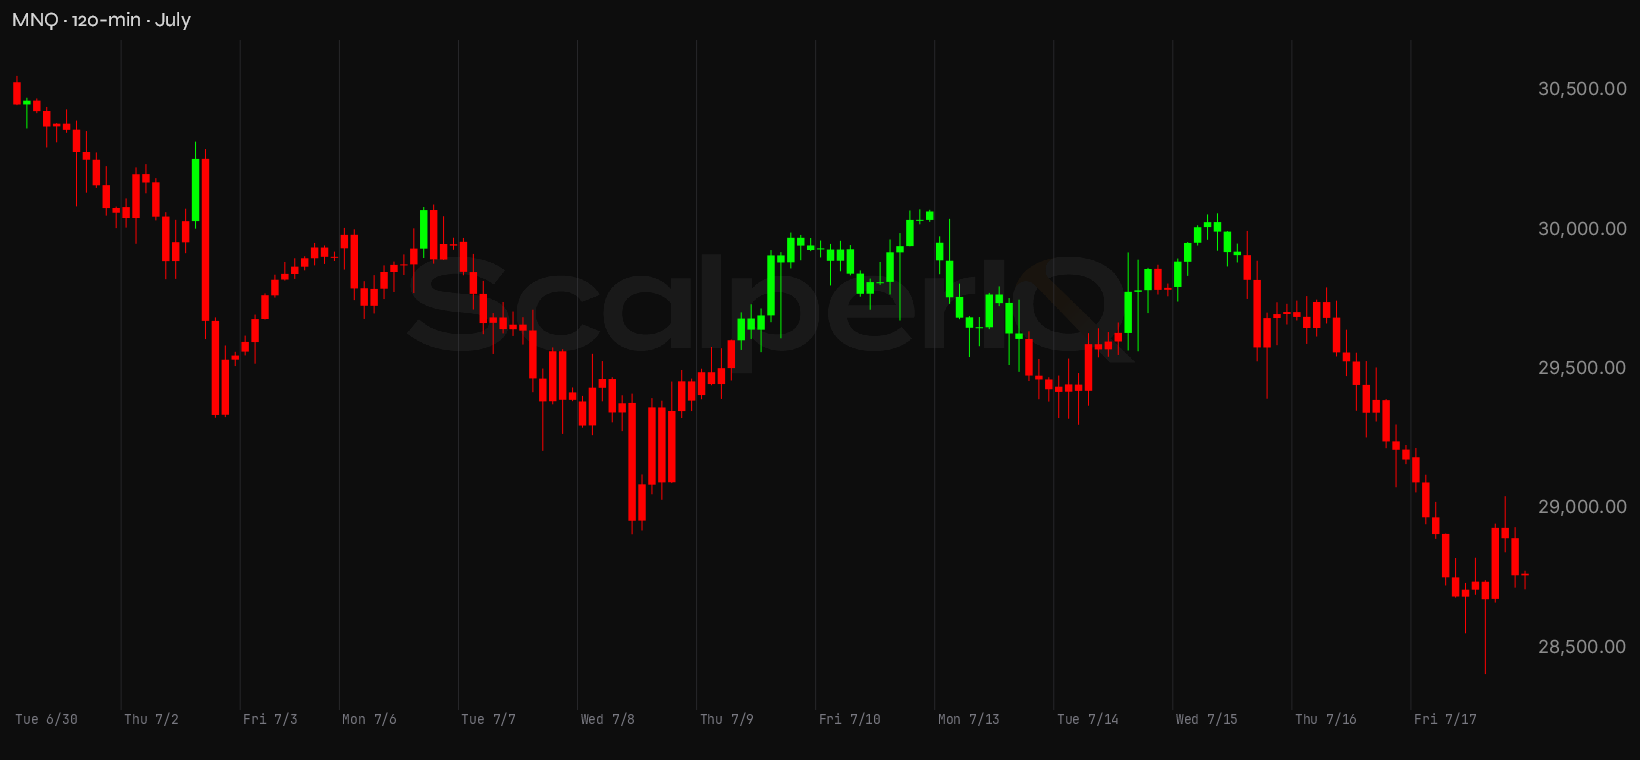
MNQ's cumulative delta for July has run to −68,066 — a heavily negative lean that's been building since the month opened. That's not just the usual baseline hum of aggressive selling into stops and urgency; it's running meaningfully heavier than what you'd expect on a month where price started near the highs. The month opened with MNQ at the top of a multi-week range, tagged 30,555.75 as the July high early on, and has since given back over 2,100 points to the 28,408.25 low printed Friday. The cumulative delta has been leaning on the offer the whole way down — this isn't price falling through a vacuum, it's price falling with sellers actively hitting bids and lifting offers against them.
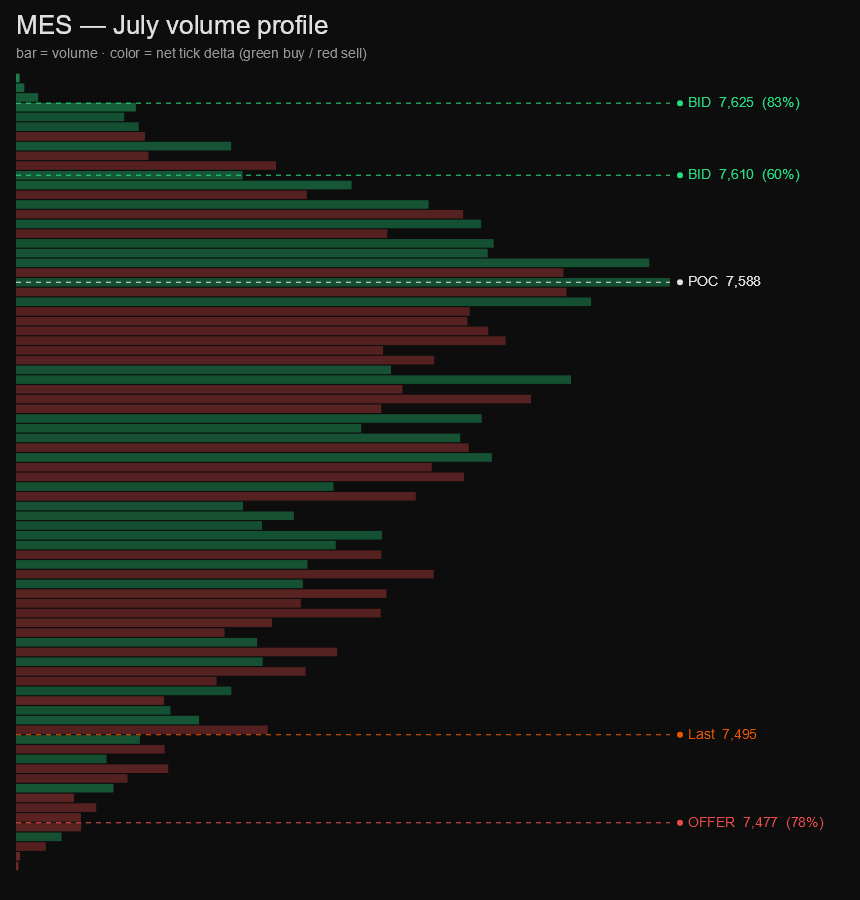
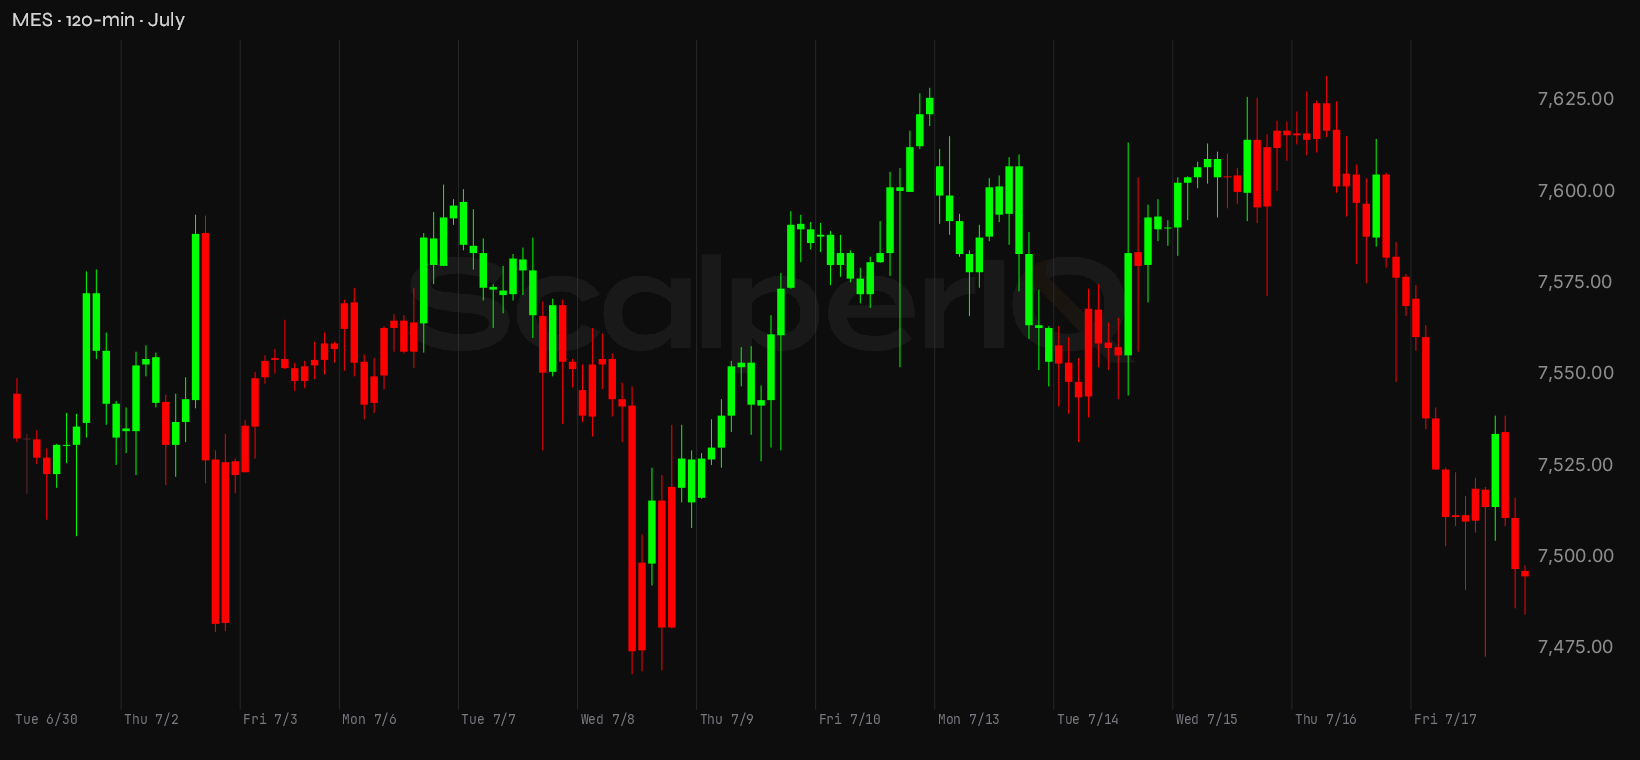
MES is a different picture. Cumulative delta for July is sitting at +12,128 — net positive on the month, even as price is down from the July open. MES tagged 7,632.00 as its high and printed 7,468.25 as the low, a 163.75-point range, and closed the week at 7,495.00. Positive cumulative delta with price near the low of the month's range is a divergence worth noting: it says the buying that did show up this month got absorbed without moving price much, while the selling pressure in MNQ was more aggressive and more sustained.
The divergence between the two instruments on a monthly basis is the thing to keep in mind as you look at the week's sessions. MNQ has been the weaker instrument all month — heavier delta, bigger range, more follow-through on the sell side. MES has held up better in cumulative delta terms, but price hasn't rewarded that relative strength. Both instruments are sitting near the bottom of their July ranges with the month not yet done.
Last Week, Up Close
Monday, July 13 was the real one — the session where the tape made its intentions clear. MNQ opened at 29,956.75, barely pressed to 30,042.50, and then sold 611.75 points off that high to close at 29,430.75 — a 656-point range. Net delta: −32,208. That's not a drift lower, that's sellers leaning on the offer in size all day. MES printed −13,798 on the same session, opened at 7,607.25, and closed at 7,553.75 — a 53.5-point decline across a 68.5-point range, which looks tame next to MNQ's move but carried the same character. Both instruments opened near the week's high and never looked back on Monday.
Tuesday, July 14 was the one session where buyers showed up. MNQ posted +11,847 net delta, ran from 29,440.00 to a high of 29,922.00, and closed at 29,794.75 — a 618.75-point range with genuine offer-lifting behind it. MES matched the story: +11,285 net delta, closed at 7,590.50. If you were looking for a bounce confirmation, Tuesday gave you the delta to point at. The problem is what came after.
Wednesday, July 15 printed the week's high on MNQ — 30,062.50 — but the session closed at 29,708.00, well off that high, and net delta was −16,115. MES ran to 7,626.25 intraday and closed at 7,615.75, with −868 delta on the session — essentially flat in delta terms but the tape was already fading off the high. Price made a new weekly high Wednesday while delta was negative on MNQ and barely neutral on MES. That divergence was the tell. The Wednesday high on MNQ is where the visual order flow flagged the weak breakout — buying conviction was absent at the top.
Thursday, July 16: MNQ −9,832, closed at 29,178.50 from an open of 29,707.75 — a 717.5-point range, all red. MES −7,015, closed at 7,569.00. Four of five sessions were negative delta on both instruments.
Friday, July 17 finished the job. MNQ opened at 29,186.75, pressed briefly to 29,220.00, and then fell to 28,408.25 before closing at 28,768.75 — an 811.75-point range, the week's widest session. Net delta: −3,895. The delta wasn't the heaviest of the week, but the selling was persistent enough to take out the prior line in the sand on MNQ (28,910.25) and leave the instrument closing below every prior support shelf from the July 6 read. MES held its line in the sand at 7,468.25 — the low of 7,473.00 never quite breached it — but closed at 7,495.00, just 27 points above that level.
Weekly net delta: MNQ −50,203. MES −21,553. Four red sessions out of five on both instruments, with the one green day sandwiched between two of the heaviest sell days of the week.
Levels I'm Watching
These come from our conviction* zones — concentrated areas of one-directional order flow that the market has already voted on. The chart marks current price with a dashed line and shows monthly levels alongside the weekly ones.
Starting with MNQ, which closed the week at 28,768.75 — and the levels picture here is striking. Every conviction zone from this week's order flow sits above current price. There is no weekly bid shelf below the close on MNQ right now.
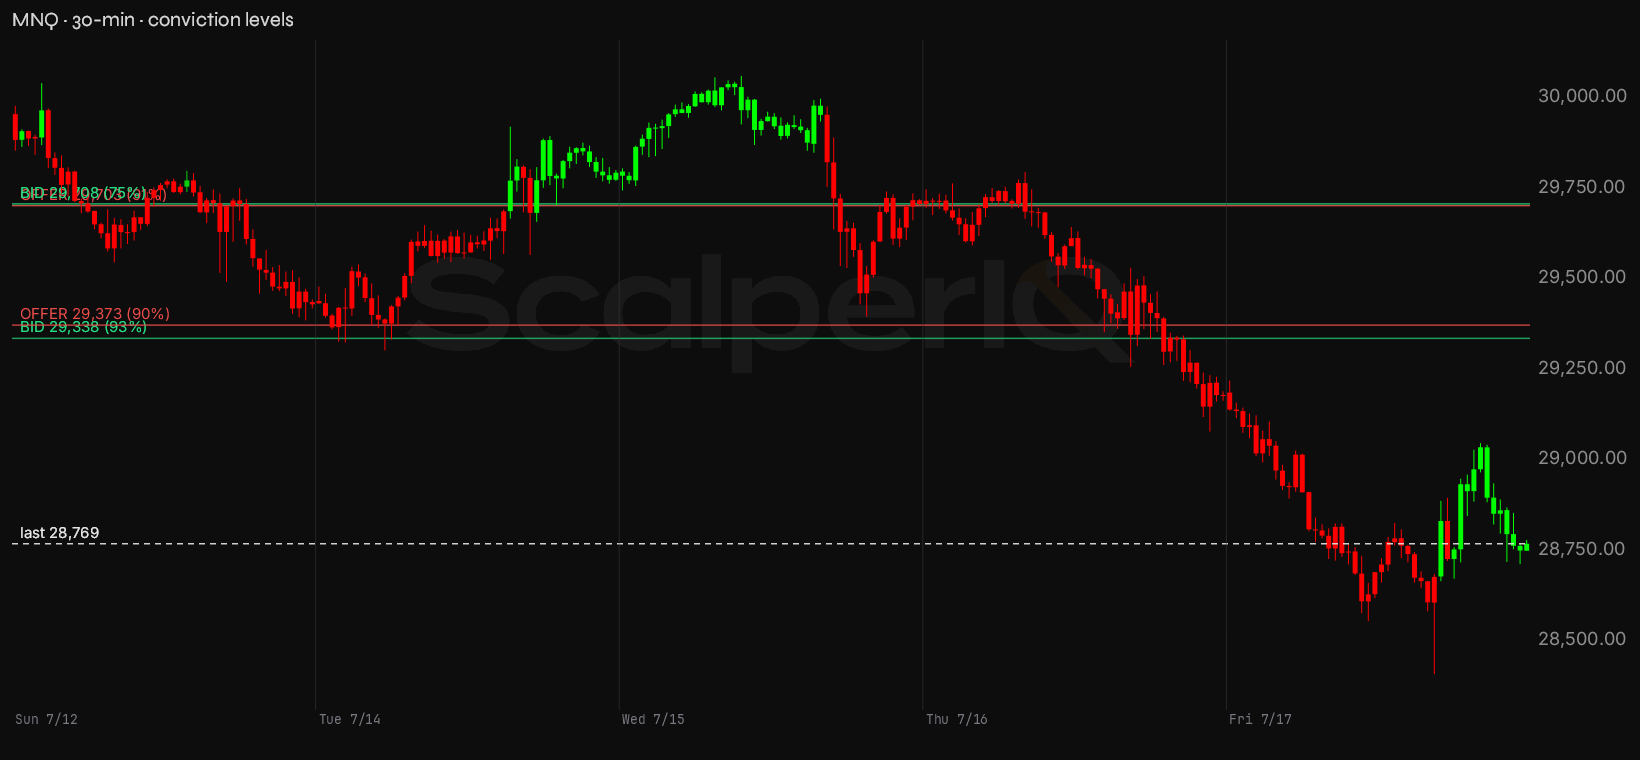
MNQ conviction zones
| Zone | Price | Read |
|---|---|---|
| Re-offer | 29,702–29,705 | Supply shelf — 91% conviction. |
| Re-offer | 29,371–29,376 | Supply shelf — 90% conviction. |
| Bid | 29,707–29,710 | Demand cluster — 75% conviction. |
| Bid | 29,335–29,339 | Demand cluster — 93% conviction. |
| Line in the sand | 28,408 | Last week's low — losing it is where I'd step back and reassess the bounce. |
The nearest level above is the weekly buying shelf at 29,335–29,339 — marked 29,338 on the chart — sitting 569 points above the close, carrying 93% conviction — order flow was nearly one-directional there. Right above it is a weekly offer shelf at 29,371–29,376, 604 points up, 90% conviction. Those two levels are stacked within 40 points of each other, which makes that 29,335–29,376 zone the first real contested area MNQ has to reclaim before anything constructive can develop. Above that, the weekly offer at 29,702–29,705 (934 points up, 91% conviction) and a weekly bid at 29,707–29,710 (940 points up, 75% conviction) form another cluster — essentially the Wednesday high zone where the tape rejected.
Below the close there is nothing. No weekly shelf, no monthly shelf — the conviction zones this month all built up at higher prices, because that is where the volume traded before the selling started. The only reference below is Friday's low at 28,408.25, which is also July's low. That is not a demand shelf and I won't dress it up as one; it's simply the last place price stopped. Open air cuts both ways — there's no shelf to lean on, and equally nothing stacked overhead to slow a bounce until 29,338.
For MES, the picture is similarly weighted to the upside, though MES has one level below the close.
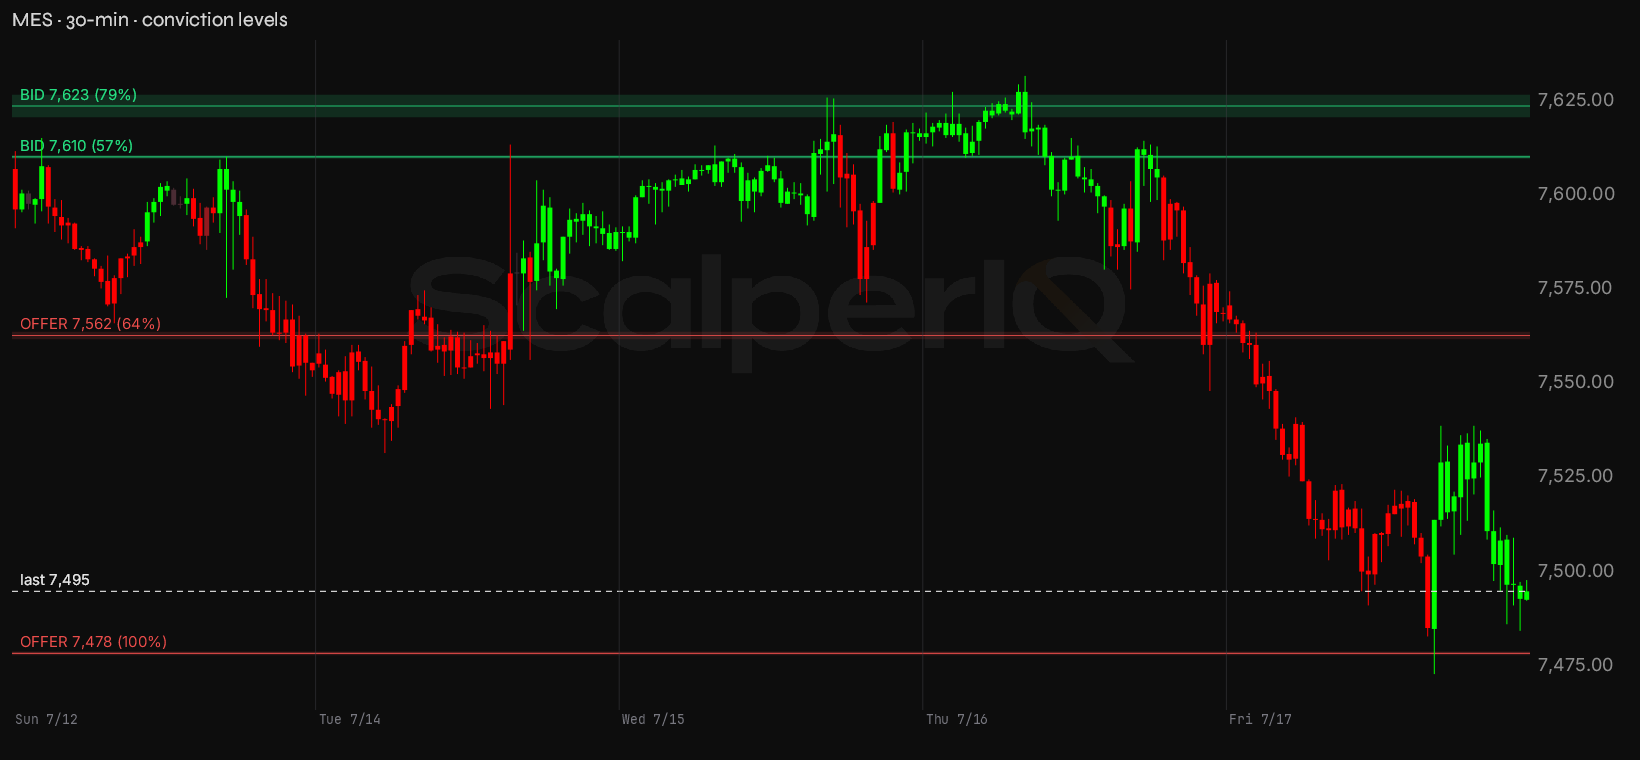
MES conviction zones
| Zone | Price | Read |
|---|---|---|
| Re-offer | 7,562–7,564 | Supply shelf — 64% conviction. |
| Re-offer | 7,478–7,479 | Supply shelf — 100% conviction. |
| Bid | 7,621–7,627 | Demand cluster — 79% conviction. |
| Bid | 7,610–7,611 | Demand cluster — 57% conviction. |
| Line in the sand | 7,473 | Last week's low — losing it is where I'd step back and reassess the bounce. |
MES closed at 7,495.00, sitting 17 points above a weekly offer shelf at 7,478–7,479 that carries 100% conviction — selling there was one-directional. Worth being precise about what that is and isn't: it's a supply shelf, not support. Price fell into it Friday, sellers had it entirely their way, and price closed back above. If MES trades down there again I'm not expecting it to hold price up — I'm watching whether sellers show up a second time, which tells you this is continuation, or whether they don't, which is the first real sign the selling is running out. The next level above is the weekly offer at 7,562–7,564, 67 points up, 64% conviction. Above that, the weekly bid shelf at 7,610–7,611 (115 points up, 57% conviction) and the weekly bid at 7,621–7,627 (128 points up, 79% conviction).
The one thing I need to see: MNQ reclaiming the 29,338 bid shelf on a session where net delta is positive — buyers lifting the offer through that level, not just price drifting up on light volume. Without that, the path of least resistance is still lower, and MES revisiting 7,478 is the next thing that tells us something.
On the Calendar
The scheduled risk worth timing around this week:
- Thursday, July 23 — Initial Jobless Claims, 8:30 AM ET. Most weeks this is background noise, but an elevated print can thin the book quickly around the number and widen ranges in the 8:15–9:00 AM ET window. The first move off the data tends to be fast and not always clean — the tape usually settles into a clearer direction in the 20–30 minutes after the print.
Light calendar week otherwise — the volatility risk is concentrated Thursday morning.
Bottom Line
The bias going into the week of July 20 is cautiously bearish on MNQ, conditional on the 29,338 bid shelf staying overhead. MNQ closed below every prior support shelf from last week's read, its line in the sand is gone, and cumulative delta for July has been running heavy to the sell side all month. MES held its line in the sand by a thread — 7,473 low versus 7,468.25 line — and its monthly cumulative delta is still positive, which keeps the MES picture less clean than MNQ's. If this read is wrong, MES is where it shows first: a session where MES lifts off 7,478 on rising net delta would be the tell that the sell pressure is exhausting. MNQ leads if the thesis holds; MES leads if it comes into question.
* Conviction % — how one-sided the order flow was at that price. 100% means it traded essentially one direction; 50% means buyers and sellers fought it to a draw. It's a read on agreement, not size — a decisive level can still be a thin one.
* Delta means raw tick delta — executed buy volume minus sell volume, straight off the tape.
* MNQ / MES are the Micro E-mini Nasdaq-100 and S&P 500 futures — same index price action as the full-size NQ / ES, at a smaller contract size. We read the micros because they're where most retail order flow lives; the delta and volume figures here are micro-contract counts.
Delta Reads are my own read of the order flow — informational only, not financial advice and not a recommendation to buy or sell anything. Trading futures is not suitable for all persons: it carries a substantial risk of loss, and you can lose more than your initial investment. This is my interpretation of the data and it can contain errors — in the data, in the analysis, or both. Do your own due diligence and trade your own plan.

Get the Delta Reads
Our weekly order-flow read on MES and MNQ — what the tape did, and the levels we're watching next. One email a week. No noise.
See what ScalperIQ looks like on a live chart.
Try Free for 14 DaysNo credit card required in the US (outside the US, a card is required to start). Available on MotiveWave, EdgeProX, and NinjaTrader.