FAQs & Troubleshooting
I see "Waiting for ScalperIQ Tick Engine..." — what does this mean?
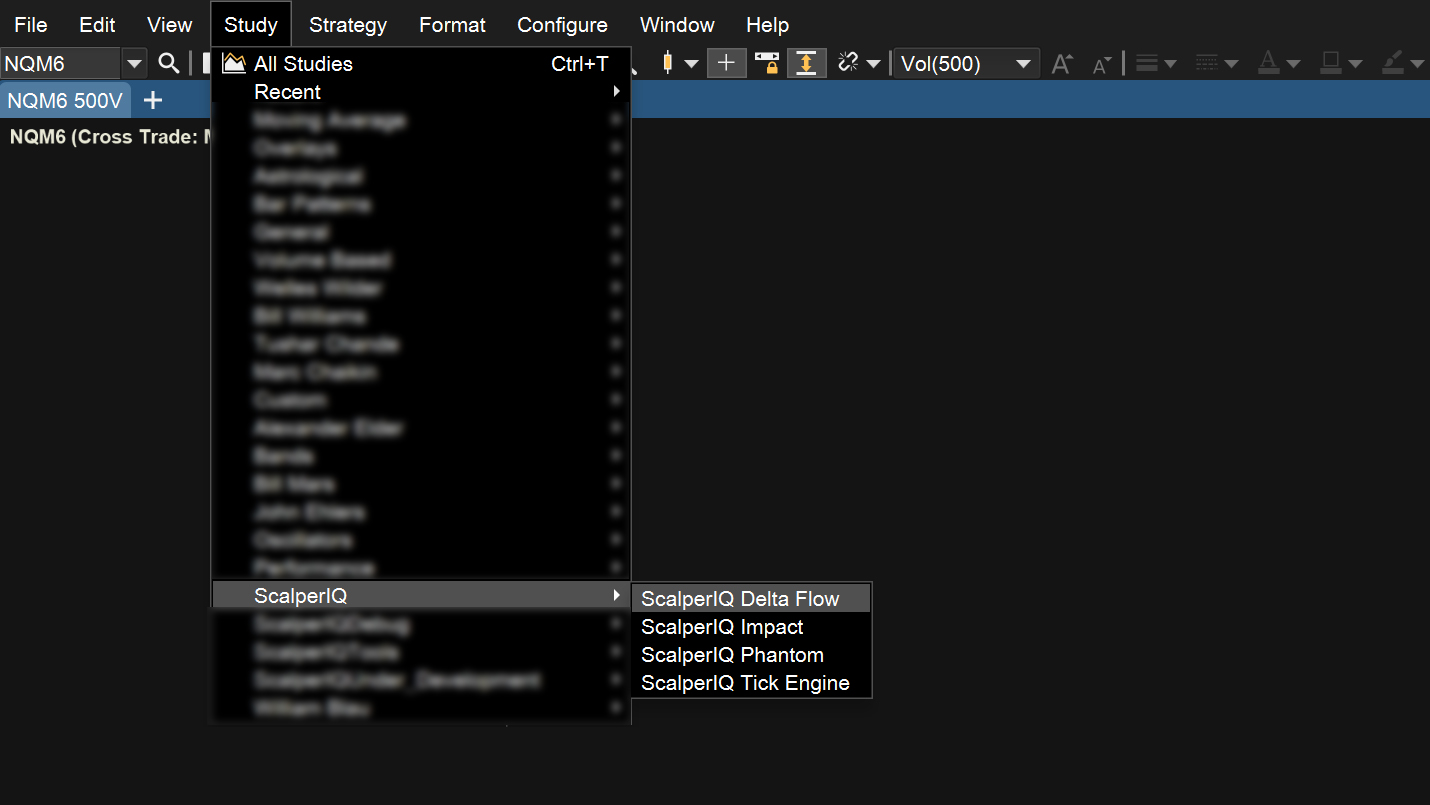
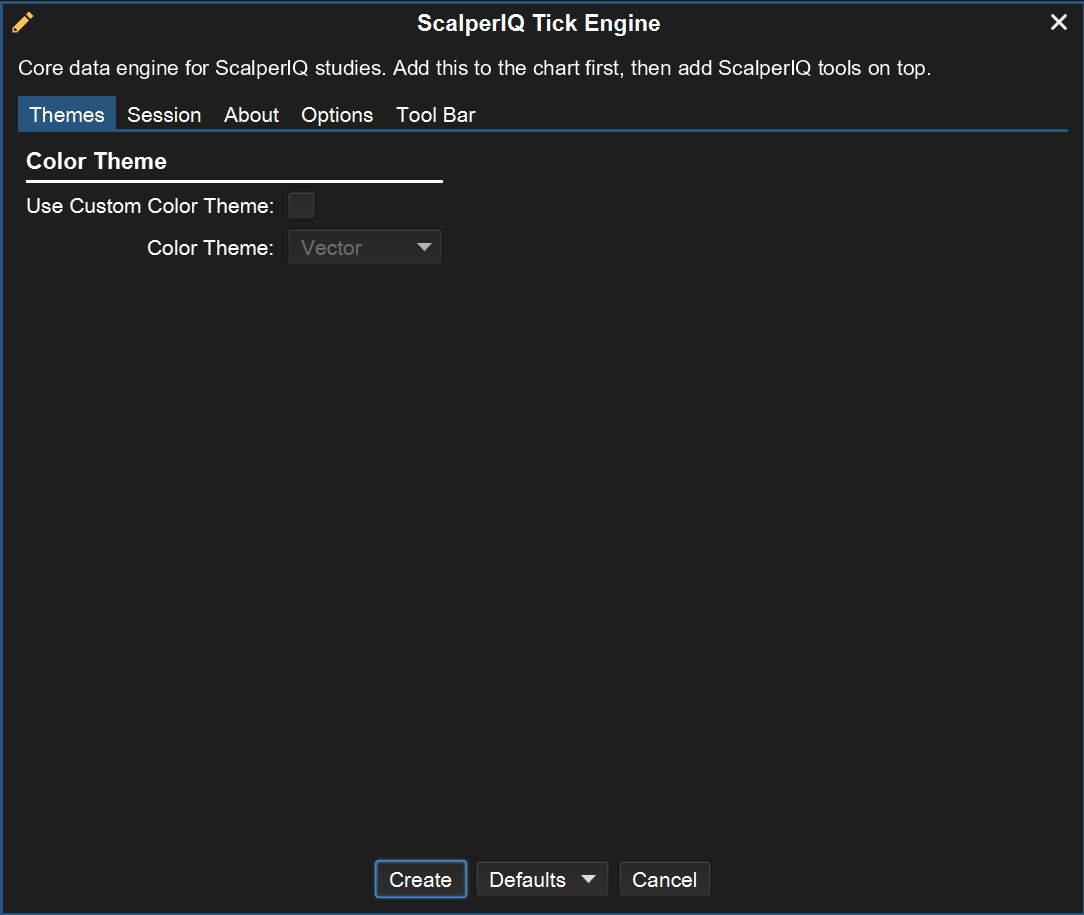
ScalperIQ studies (Delta Flow, Phantom, Impact) require the Tick Engine to be on the same chart. Go to Study > ScalperIQ > ScalperIQ Tick Engine and add it first. Once the engine is loaded, your studies will automatically connect and begin displaying data.
I added the Tick Engine but my study still isn't showing data.
The Tick Engine needs a moment to process historical tick data after being added. Wait for the engine's loading message to clear. If the issue persists, try removing and re-adding the study. Make sure both the engine and the study are on the same chart with the same instrument and bar type.
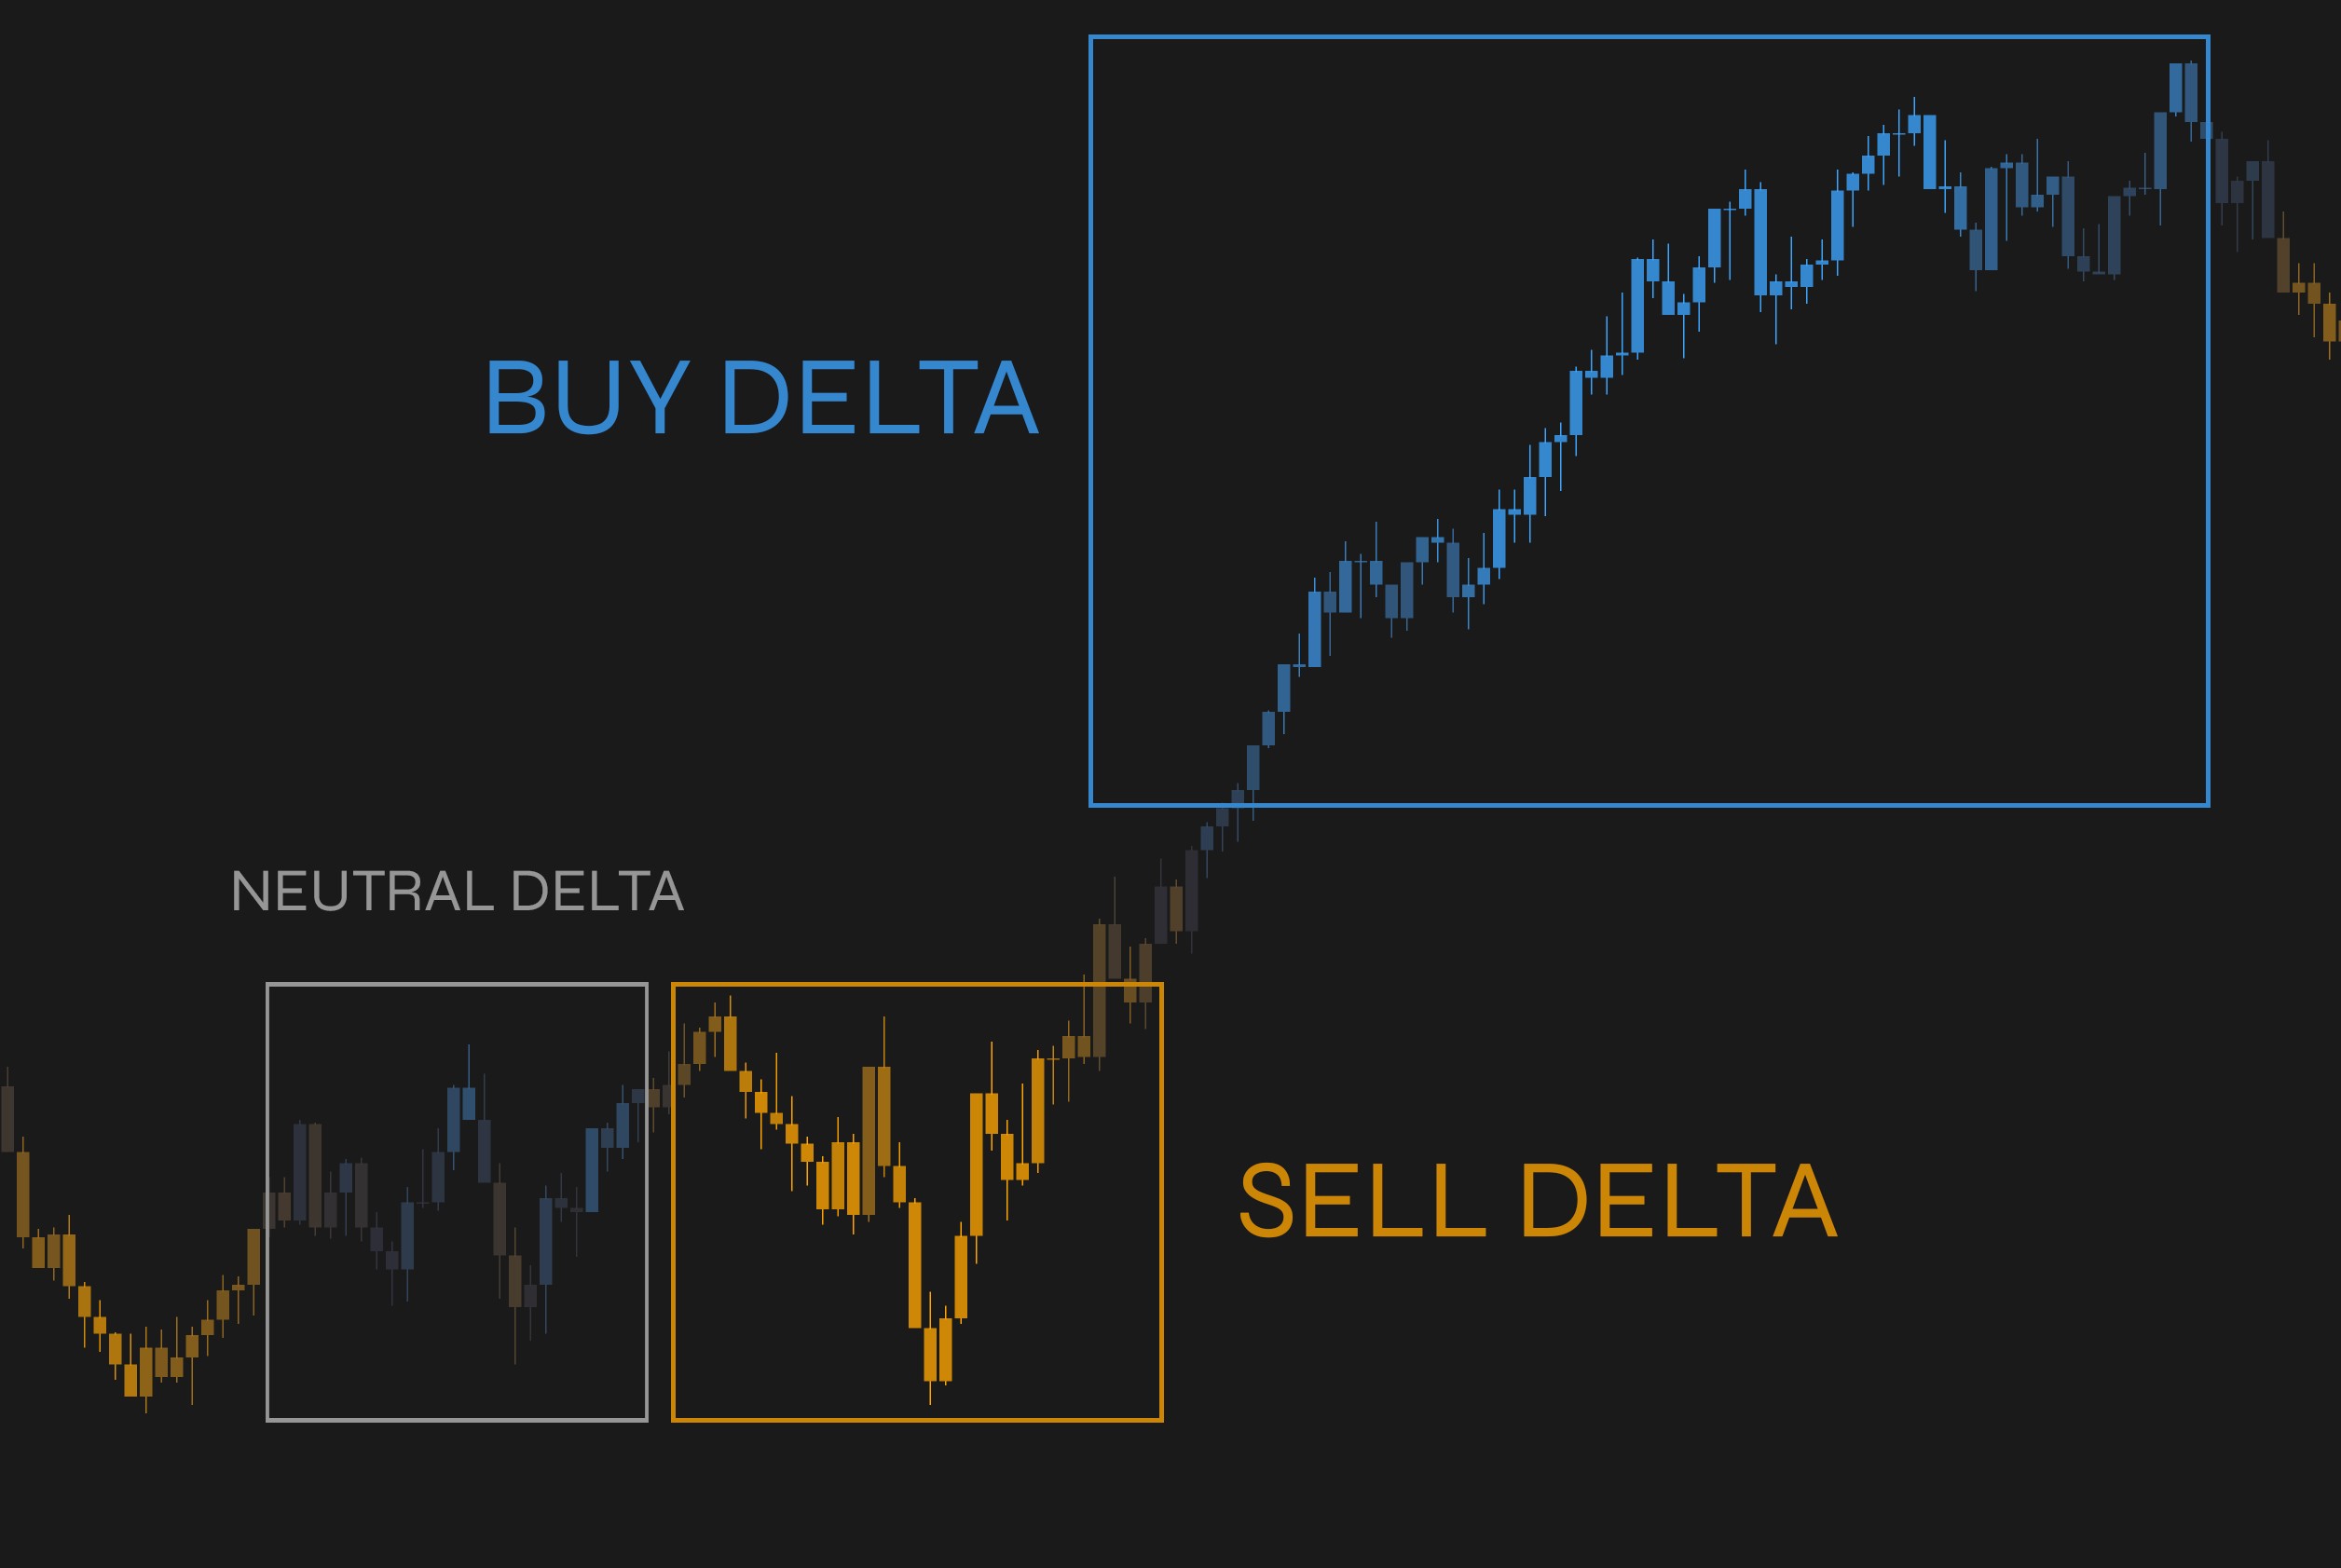
Why do positive delta candles appear in downtrends?
Due to averaging period smoothing, higher periods show delayed reactions to order flow changes.
Candles aren't colored after license placement?
Toggle a setting, remove and reapply the study, verify license placement, restart platform, or contact support.
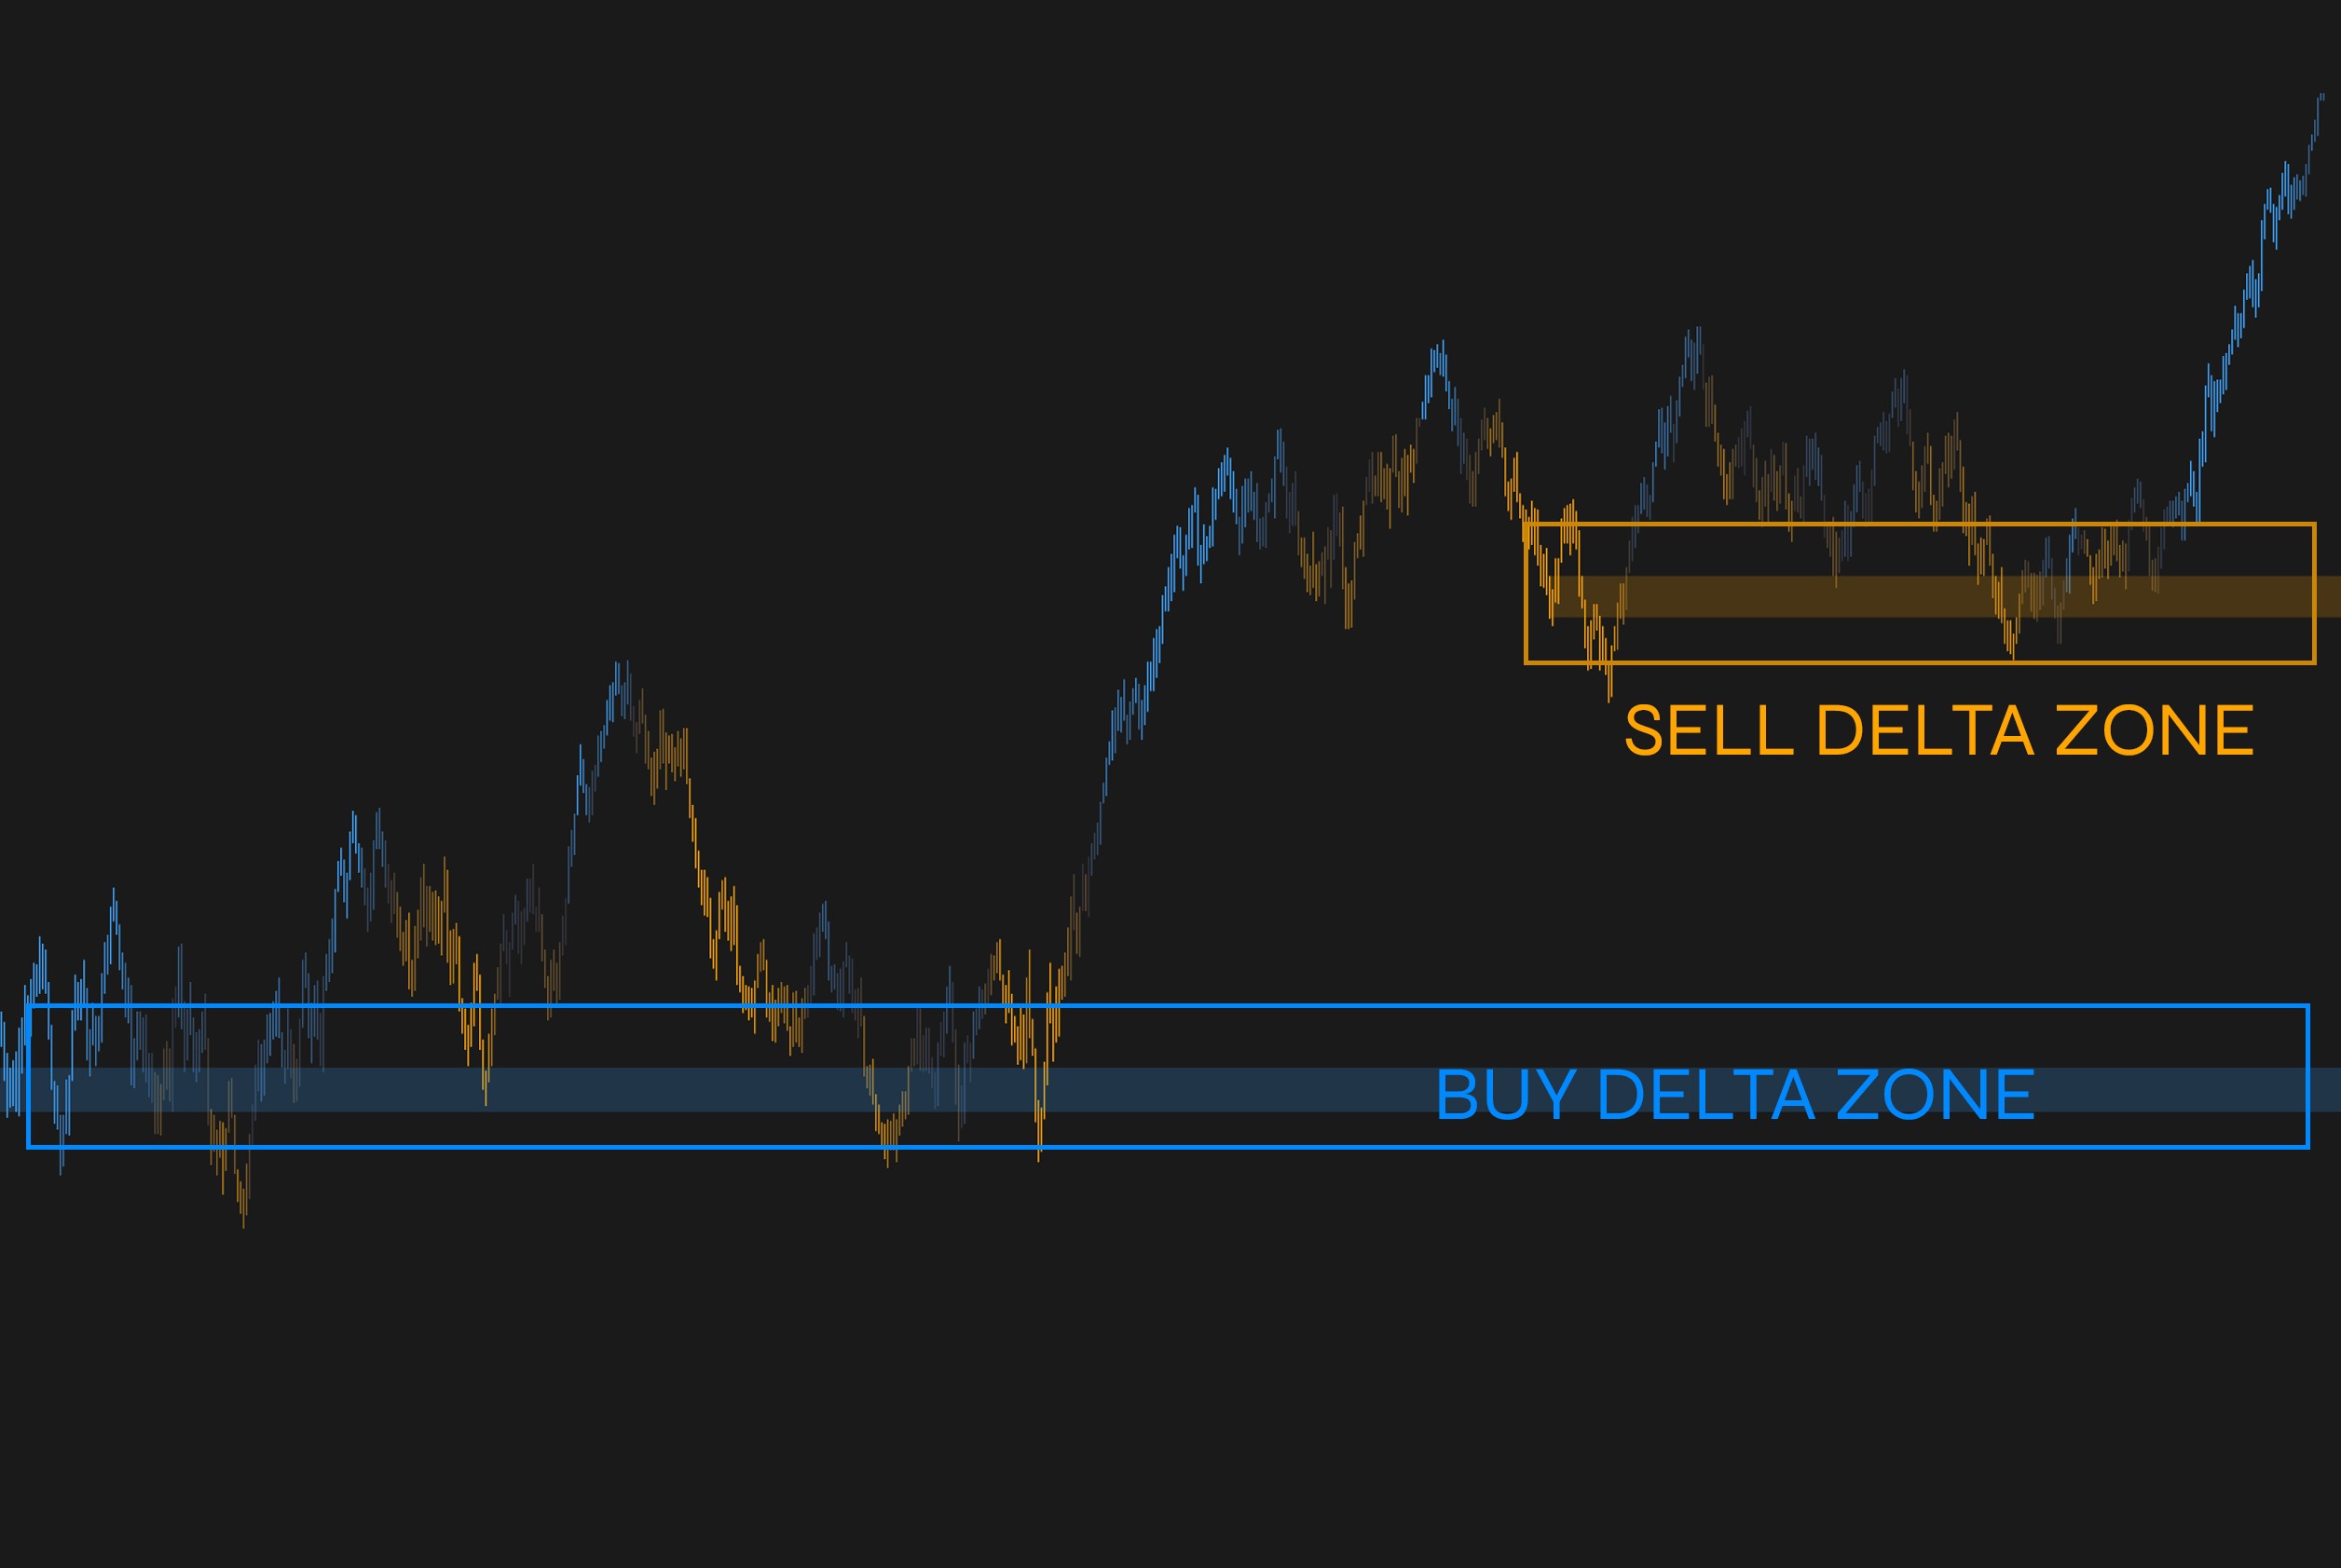
Why do zones change position with averaging period changes?
Modifications alter delta calculations, affecting what qualifies as significant shifts.
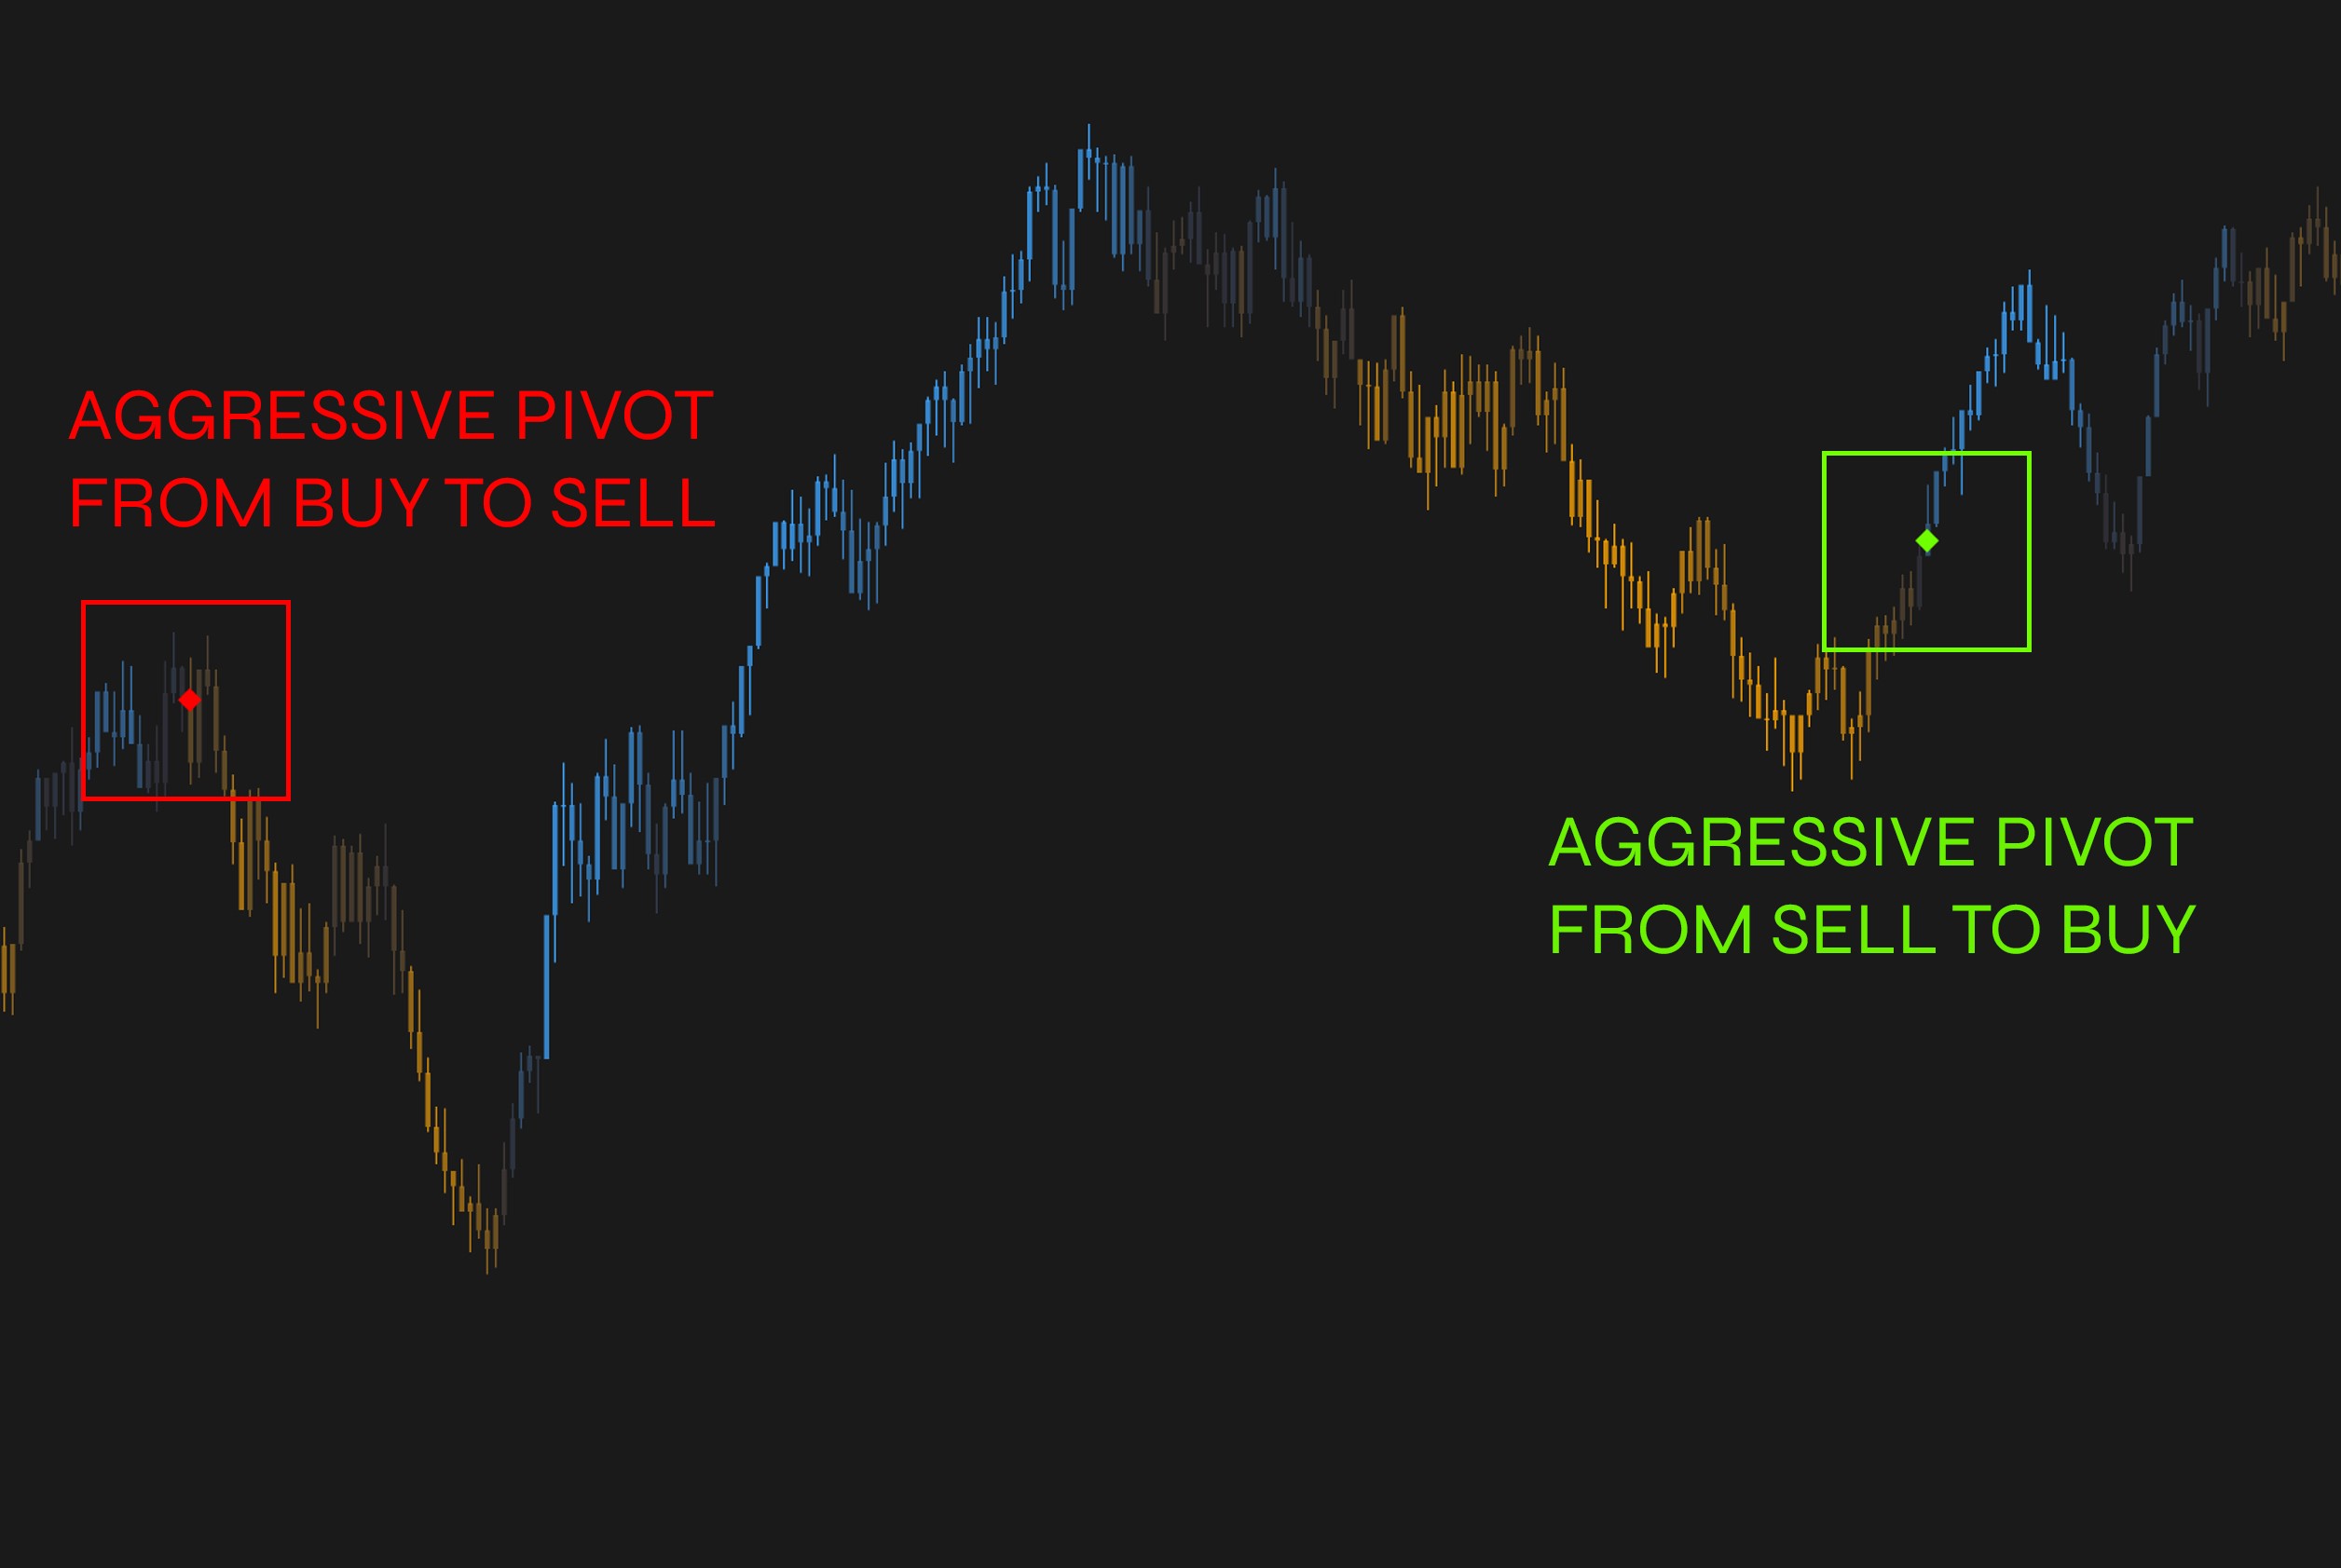
I see less zones/delta pivots than in my max settings. Why?
The setting specifies the maximum number of pivots/zones that may be displayed. If fewer pivots/zones appear, it means fewer qualifying areas were detected than the max setting.
Why isn't candle coloring active?
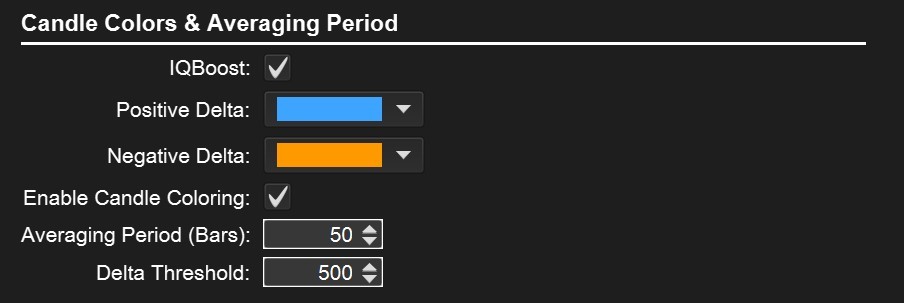
Ensure "Enable Candle Coloring" is active and delta exceeds threshold. Custom themes disable individual color overrides.
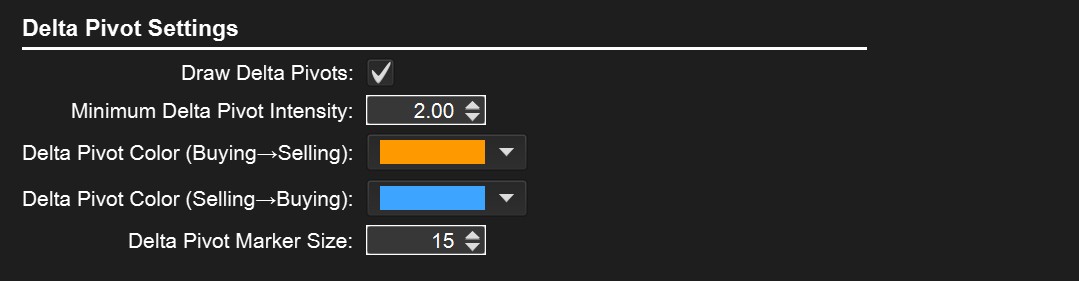
Delta pivots not visible?
Confirm "Draw Delta Pivots" is enabled.
Slow indicator performance?
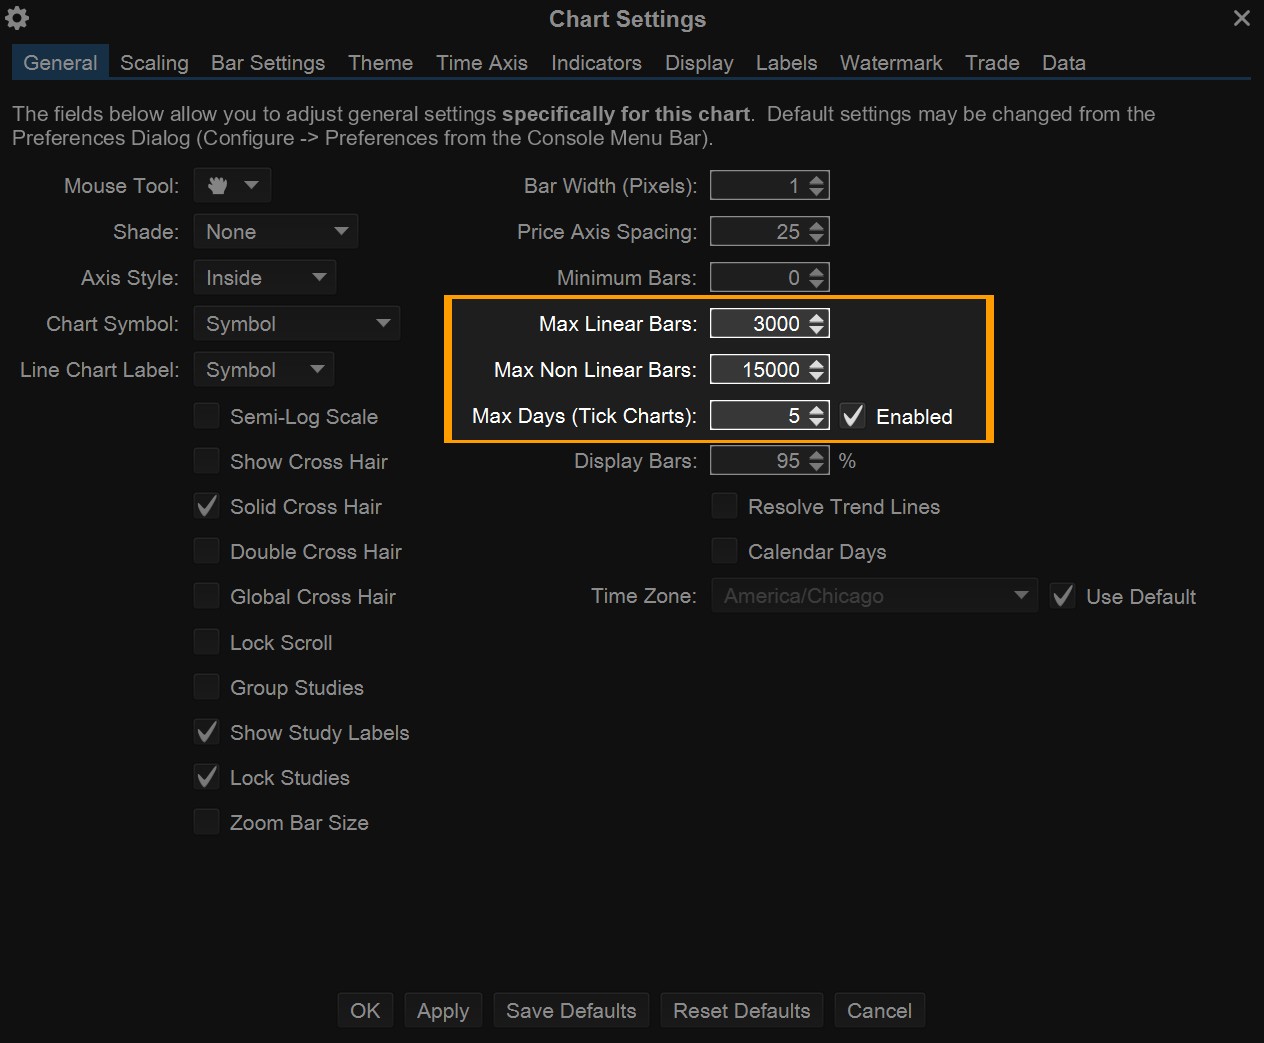
Reduce chart bars via Chart Settings and Max Linear/Non-Linear Bar count. Remove and reapply the study: delete the study from your chart and reapply it.
Panning or zooming feels laggy on high-volume charts (MotiveWave 7)?
On MotiveWave 7, dragging or zooming a high-volume chart with many sessions loaded can feel laggy. This is a MotiveWave 7 platform behavior — MW7 re-processes all loaded tick data on each pan, so the cost grows with how much history the chart holds. Reduce the Number of Sessions to Load in MotiveWave's Chart Settings (data range) on high-volume instruments — lowering it from 10 to 3 on a 3000-volume MNQ chart clears the lag entirely and speeds up chart loading. MotiveWave 6 is unaffected, and your signal accuracy is the same regardless of this setting.
Can I use during pre-market/extended hours?
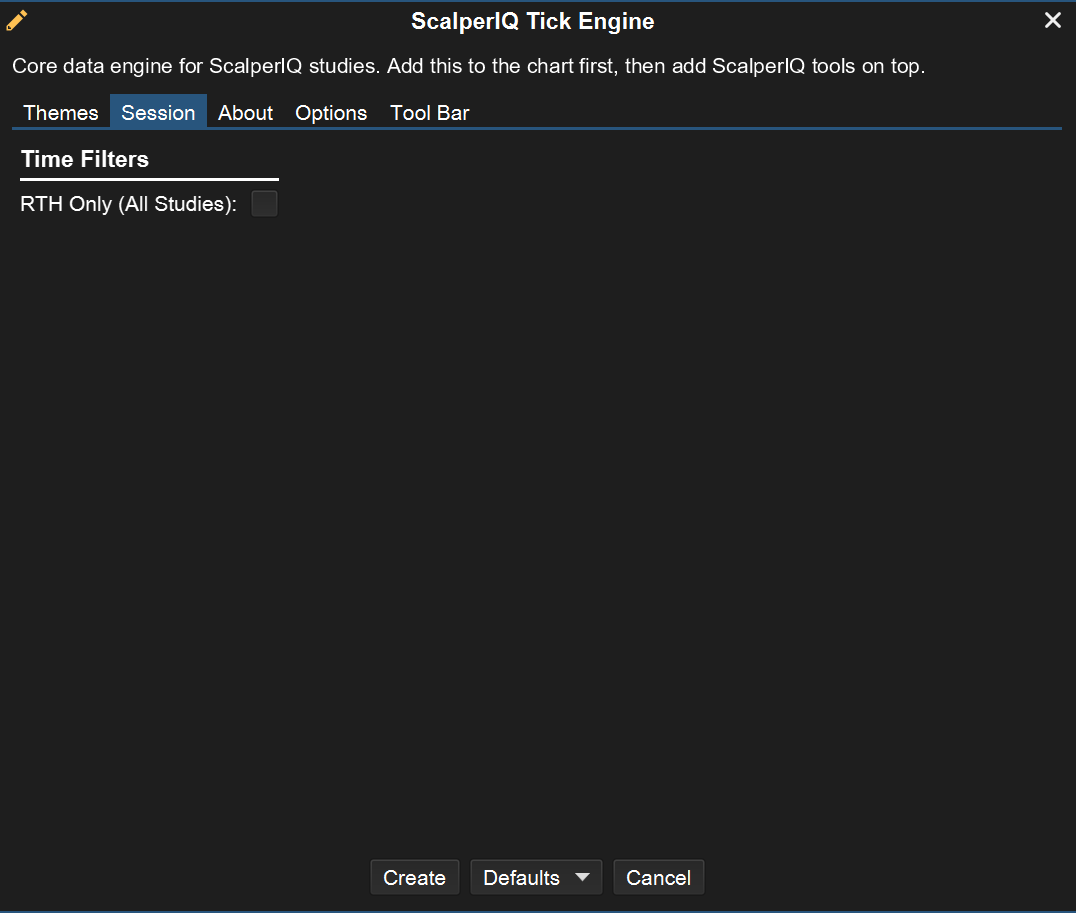
Yes. In Delta Flow, open the Session tab and uncheck "Use RTH Data Only."
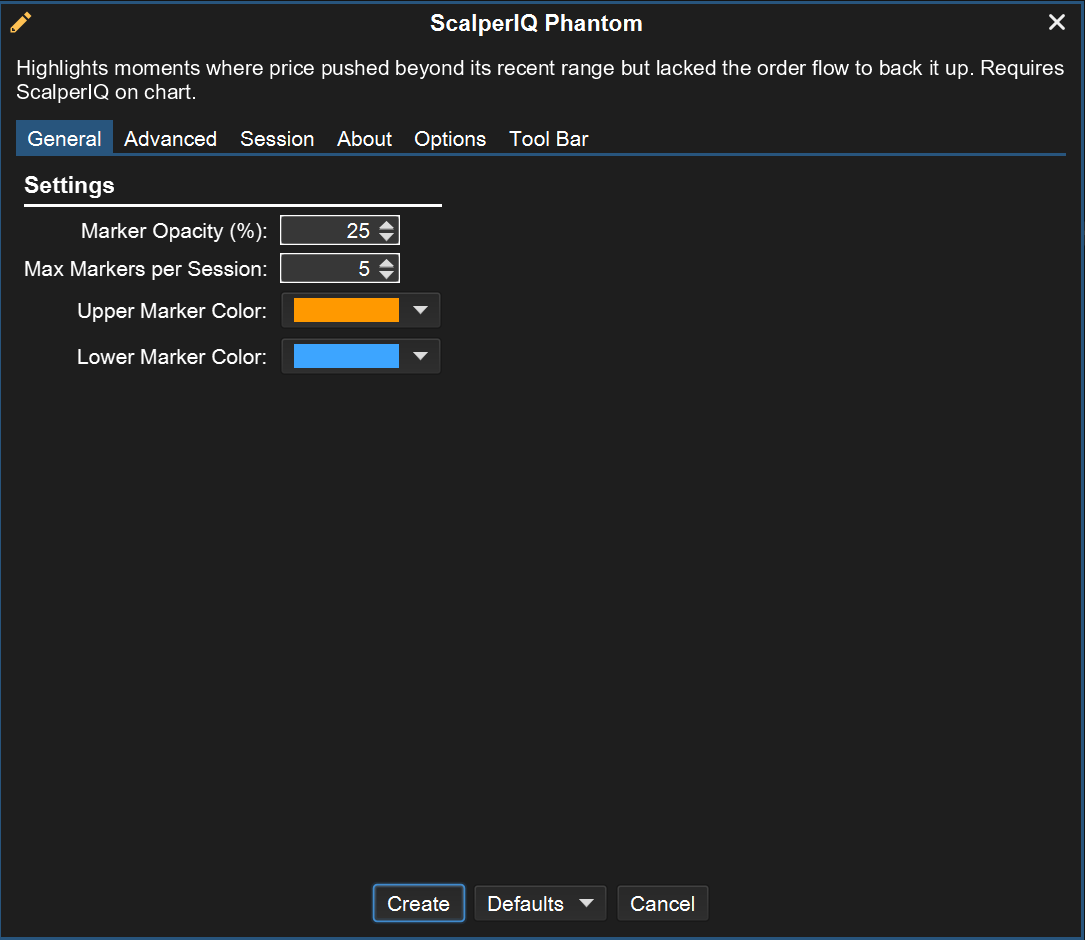
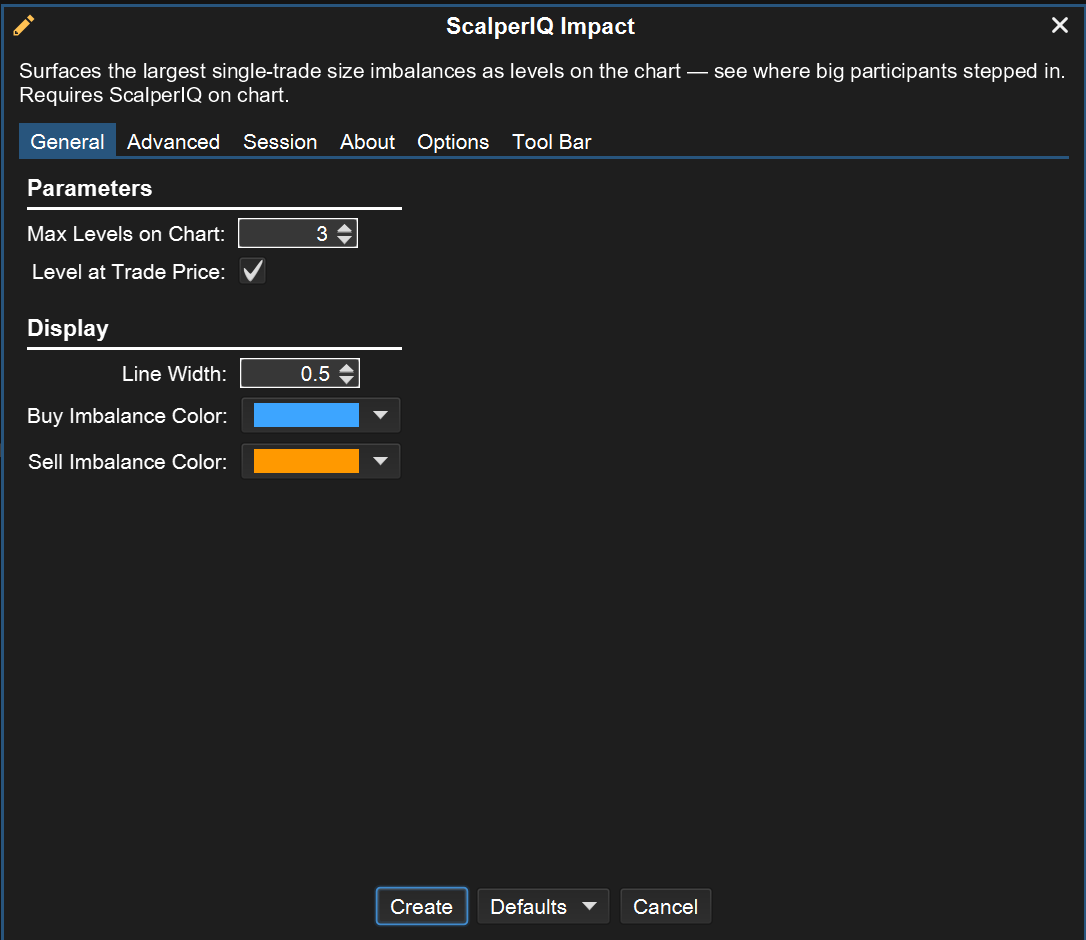
Phantom and Impact use their own overnight controls instead — Show ETH Markers (Phantom) or Show ETH Levels (Impact), each with its own Max setting.
Why do I see different signals than another user on the same asset and timeframe?
Tick data is inherently noisy and can vary slightly between users due to differences in data feed timing or how local data is stored. Complete synchronization between users may not always be possible, especially if one user's chart has been running longer than another's.
However, differences in alignment do not reduce the accuracy of signals. The indicator is designed to adapt to incoming data consistently, meaning that even if two users see slight variations, the signals themselves remain reliable and relevant for each user's setup.
For all other questions please email info@scalperIQ.com