
Delta Read · Week of July 20, 2026 — Friday Broke the Floor
Get the Delta Reads
Our weekly order-flow read on MES and MNQ — what the tape did, and the levels we're watching next. One email a week. No noise.
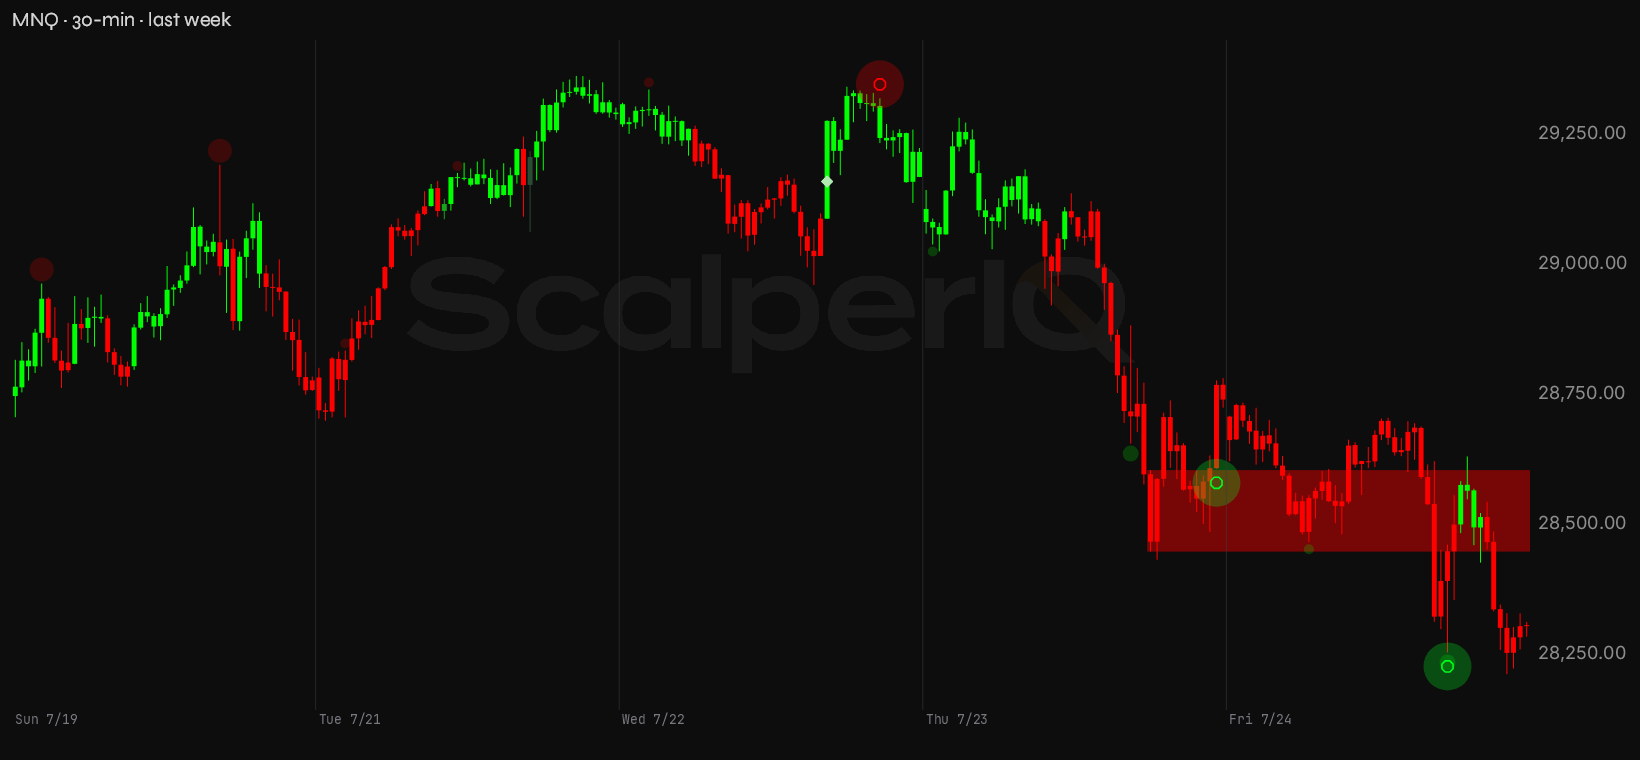
Last week's forward watch was specific: MNQ reclaiming the 29,337 bid shelf on a session where net delta turned positive — buyers lifting the offer through that level, not price drifting up on thin flow. That never happened. Instead, the 29,335–29,339 shelf that had been the line we needed broke early in the week and never came back. Both instruments came in with a neutral bias, and both resolved the same way — lower. MNQ's line in the sand at 28,408.25 was gone by Friday's close. MES lost its line at 7,473 as well, though it held up better on a percentage basis. Mixed is the generous read; the weight of the week was clearly on the sell side.
Here's the week on a 30-minute chart with the order flow marked up — MNQ's 1,151-point range tells most of the story, but the delta behind it tells the rest.
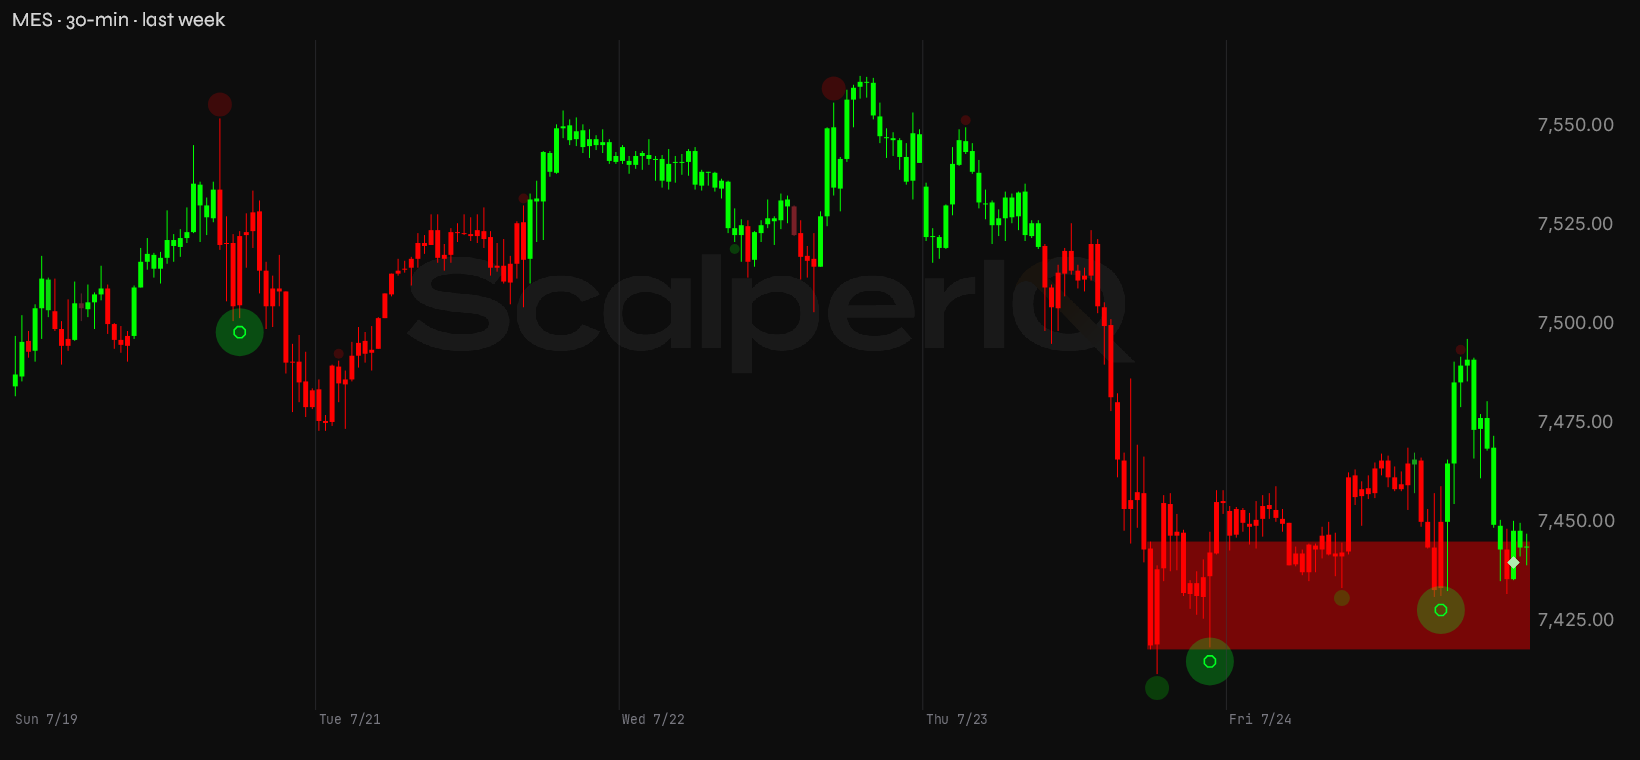
MES painted a similar picture in a smaller frame: a 151.25-point range on the week, closing at 7,444 versus a prior-week close of 7,495, down 51 points. The ranges look different in magnitude but the structure was nearly identical — a Tuesday push higher, a Wednesday stall, then Thursday and Friday peeling it all back.
Quick version: Both instruments are below last week's key levels, Friday's delta was the heaviest selling of the week, and FOMC lands Tuesday–Wednesday. The burden of proof is on buyers.
July Has Been Running Two Different Stories
Month-to-date, MNQ and MES are telling opposite delta tales — and that divergence is worth sitting with before we get into the week's sessions.
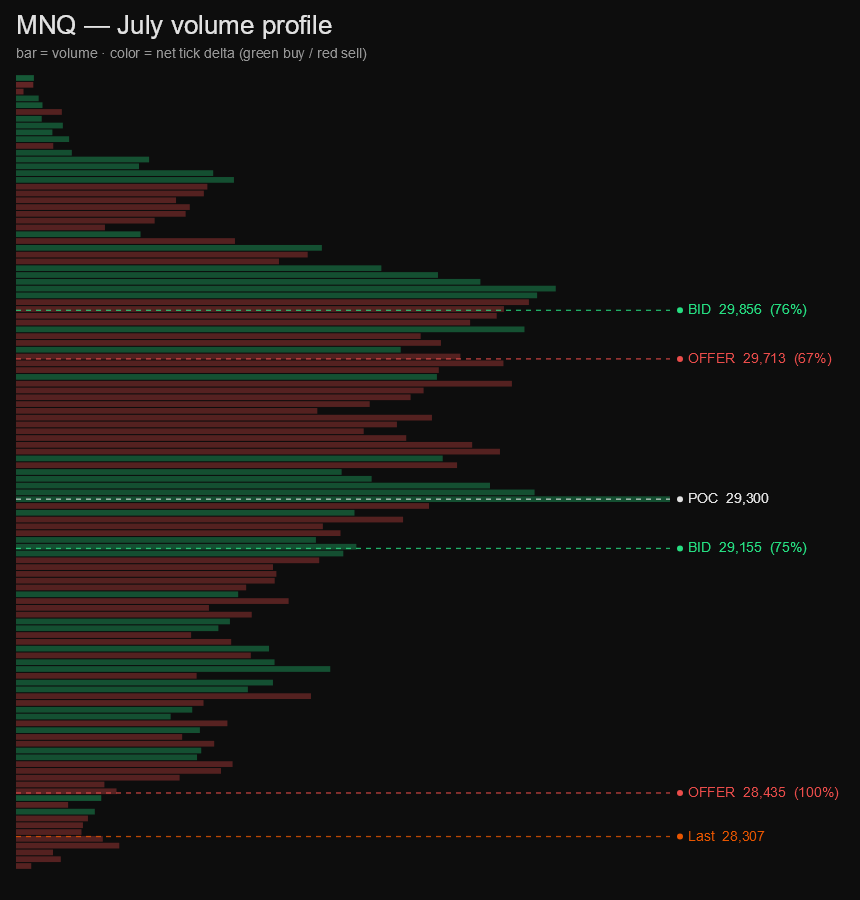
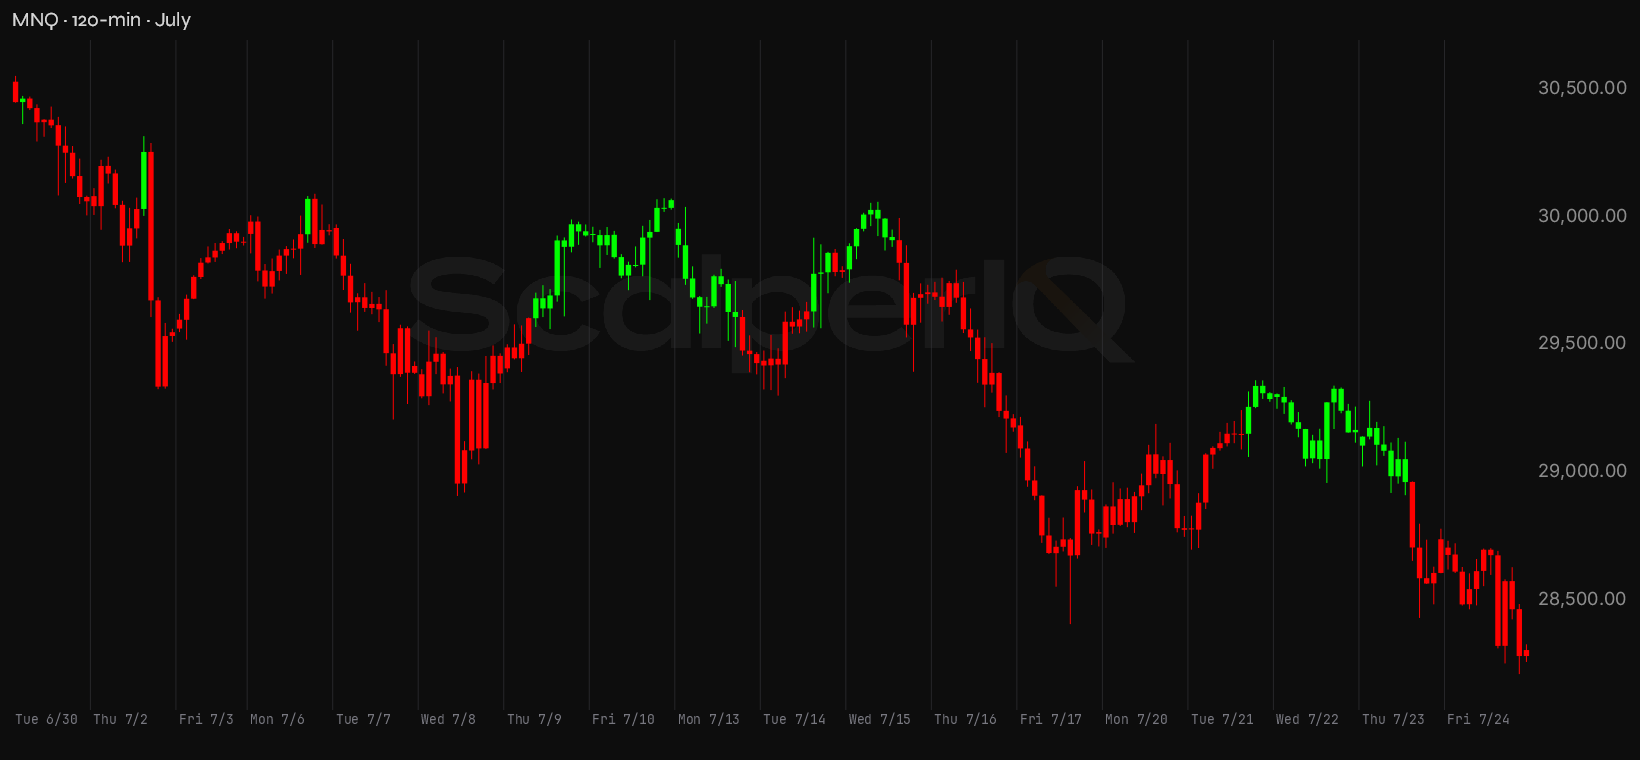
MNQ's cumulative delta for July sits at −101,333. That's not baseline noise — that's a month where aggressive sellers have been consistently hitting the bid, and the cumulative lean has run heavier than a typical month's structural negative. Price peaked at 30,555.75 early in the month and has since worked all the way down to a low of 28,212.5 — a 2,343.25-point range on the month. The delta has been running red nearly every session of that decline, which means this isn't short covering or passive drift. Sellers have been leaning on the bid the whole way.
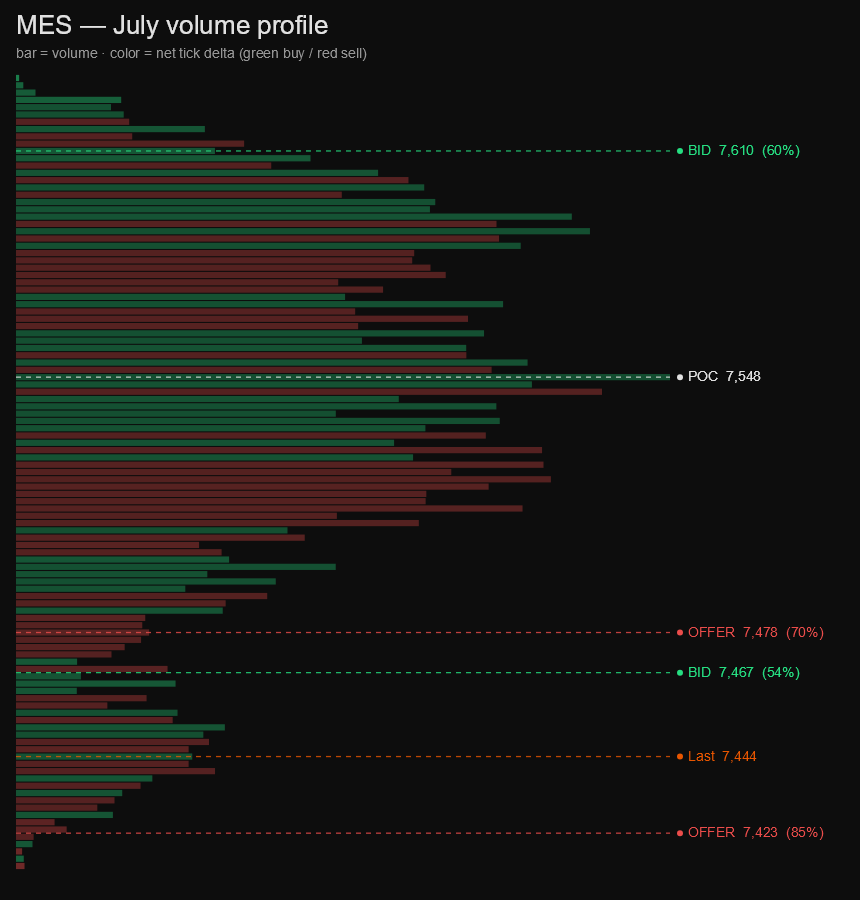
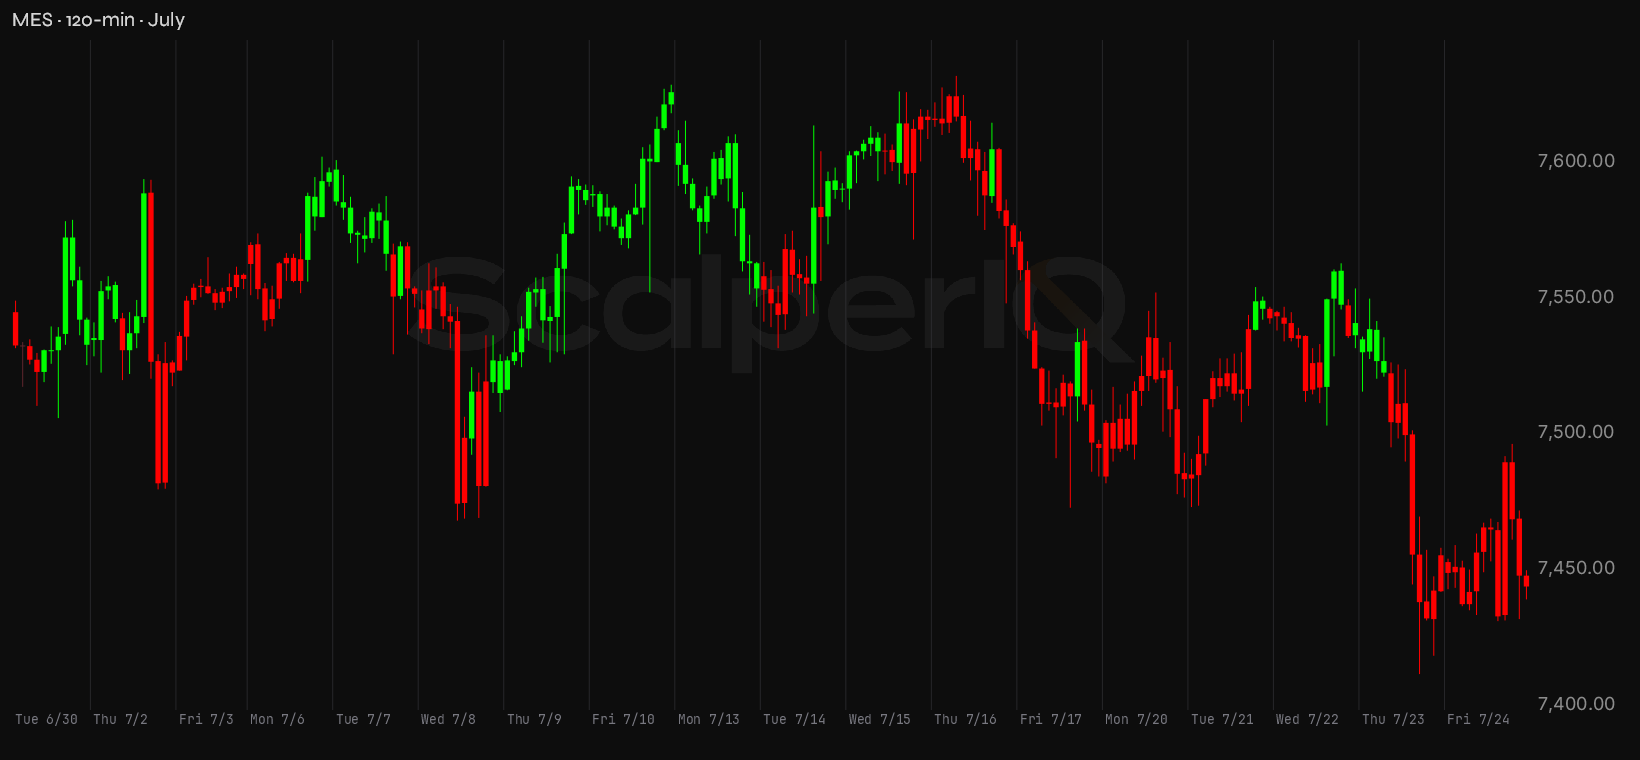
MES is the counterpoint. Cumulative delta for July is +19,096 — net positive on the month, with a month-to-date range of 220.25 points between 7,632 and 7,411.75. That positive cumulative in MES while MNQ runs deeply negative is a divergence worth noting. It's not a bullish signal on its own — MES closed the week at 7,444, well off its monthly high — but it does suggest the tech-heavy selling in MNQ hasn't fully propagated into the broader index. The two instruments are not confirming each other cleanly this month, and that kind of divergence tends to resolve in one direction before long.
Last Week, Up Close
Monday set the tone without doing much. MNQ opened at 28,747.50, pushed to a session high of 29,192.50, then faded 414.75 points off that high to close at 28,777.75 — essentially flat on the day at +30.25 points, but with −13,597 net delta underneath it. Sellers were hitting the bid all session while price barely moved. MES was the same: −7,198 net delta, a 75.5-point range, closed down just 1 point. Both charts were flashing a warning on Monday that the session's price stability was being bought with seller aggression, not genuine demand.
Then Tuesday. MNQ printed +16,573 delta and closed up 506.75 points at 29,290 — buyers were lifting the offer and price followed. The session low of 28,700 held clean and the tape ran nearly the full range to the upside, closing just 73.5 points off the session high of 29,363.50. MES confirmed: +10,746 delta, up 59 points, closing near the top of its range. This was genuine buying — the one session all week where delta and price moved together with conviction.
Wednesday is where it started to come apart. MNQ opened near Tuesday's close, pushed to 29,342.50, and then reversed — closing at 29,169 with −7,630 net delta. Down 140 points on the session, and the selling was there from the start. MES was more resilient, barely negative at −4 points with +2,797 delta, but MNQ was already distributing into the strength.
Thursday was the session that broke the structure. MNQ dropped 366.75 points, closing at 28,740.75, with −3,032 net delta. The session range was 850.5 points — a wide, ugly bar. Price touched 28,432.50 on the low, which sliced through the prior line in the sand at 28,408.25 before recovering slightly into the close. MES lost 79.5 points on the day with −6,020 net delta, closing at 7,455.50 and touching a session low of 7,411.75 — the monthly low.
Friday was the gut punch. MNQ posted −25,581 delta — by far the heaviest single-session selling of the week — and closed down 401.25 points at 28,306.75. The session high was 28,734.75, and it faded 428 points off that to close near the lows. MES closed at 7,444 with +6,643 delta on the session — a small positive print, but the context is that MES was bouncing off a Thursday low while MNQ kept getting hit. Friday's MNQ delta was not a drift lower; it was sellers leaning hard on the bid into the close of the week.
The weekly net for MNQ: −33,267. For MES: +6,968. That divergence between the two on the week mirrors the month-to-date divergence — MES is holding up relatively, MNQ is absorbing the bulk of the selling.
Levels I'm Watching
These come from our conviction* zones — areas where order flow was persistently one-directional at a specific price.
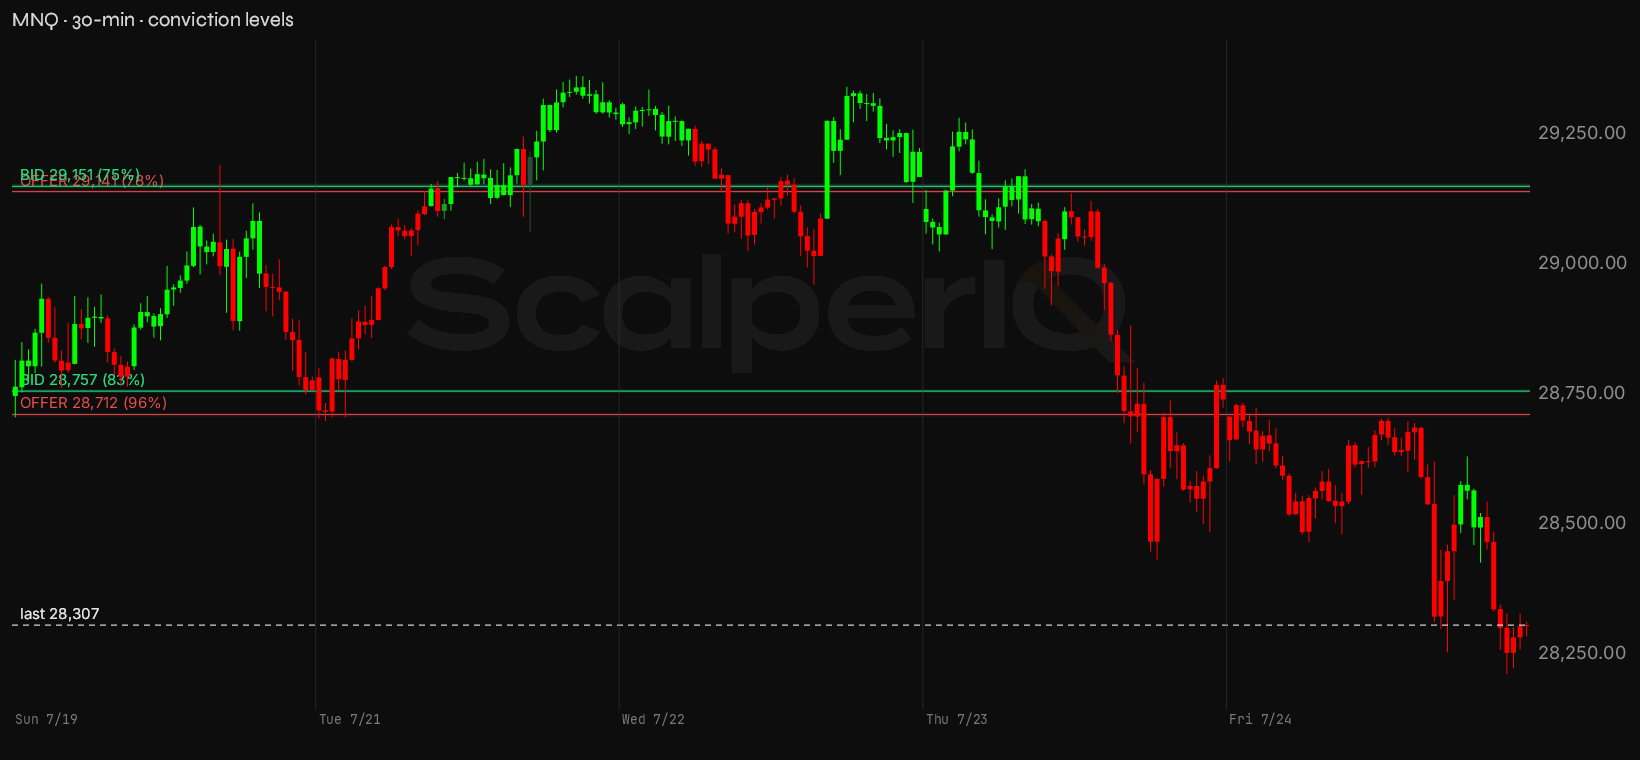
MNQ conviction zones
| Zone | Price | Read |
|---|---|---|
| Re-offer | 29,141 (29,140–29,144) | Supply shelf — 78% conviction. |
| Re-offer | 28,712 (28,708–28,715) | Supply shelf — 96% conviction. |
| Bid | 29,151 (29,147–29,156) | Demand cluster — 75% conviction. |
| Bid | 28,757 (28,754–28,760) | Demand cluster — 83% conviction. |
| Line in the sand | 28,212 | Last week's low — losing it is where I'd step back and reassess the bounce. |
MNQ closed the week at 28,306.75. Everything in the signal set is above current price. The nearest level is the 28,708–28,715 offer shelf at 28,712 — 405 points above the close — carrying 96% conviction. Order flow was nearly entirely one-directional there, and it's above current price, meaning sellers have staked out that zone. Right above it sits the 28,754–28,760 bid shelf at 28,757, 450 points above, with 83% conviction — two levels stacked tight, an offer and a bid within 50 points of each other. That cluster is the first real battleground on any bounce attempt. Above that, the 29,140–29,144 offer shelf at 29,141 (78% conviction) and the 29,147–29,156 bid shelf at 29,151 (75% conviction) form the next contested zone, both sitting 834–844 points above the close.
Below the close, it's open air. There are no weekly conviction shelves underneath 28,306.75 in this signal set. The nearest support the chart shows is the monthly structure — if MNQ continues lower, the first reference point comes from that broader context, not from last week's order flow.
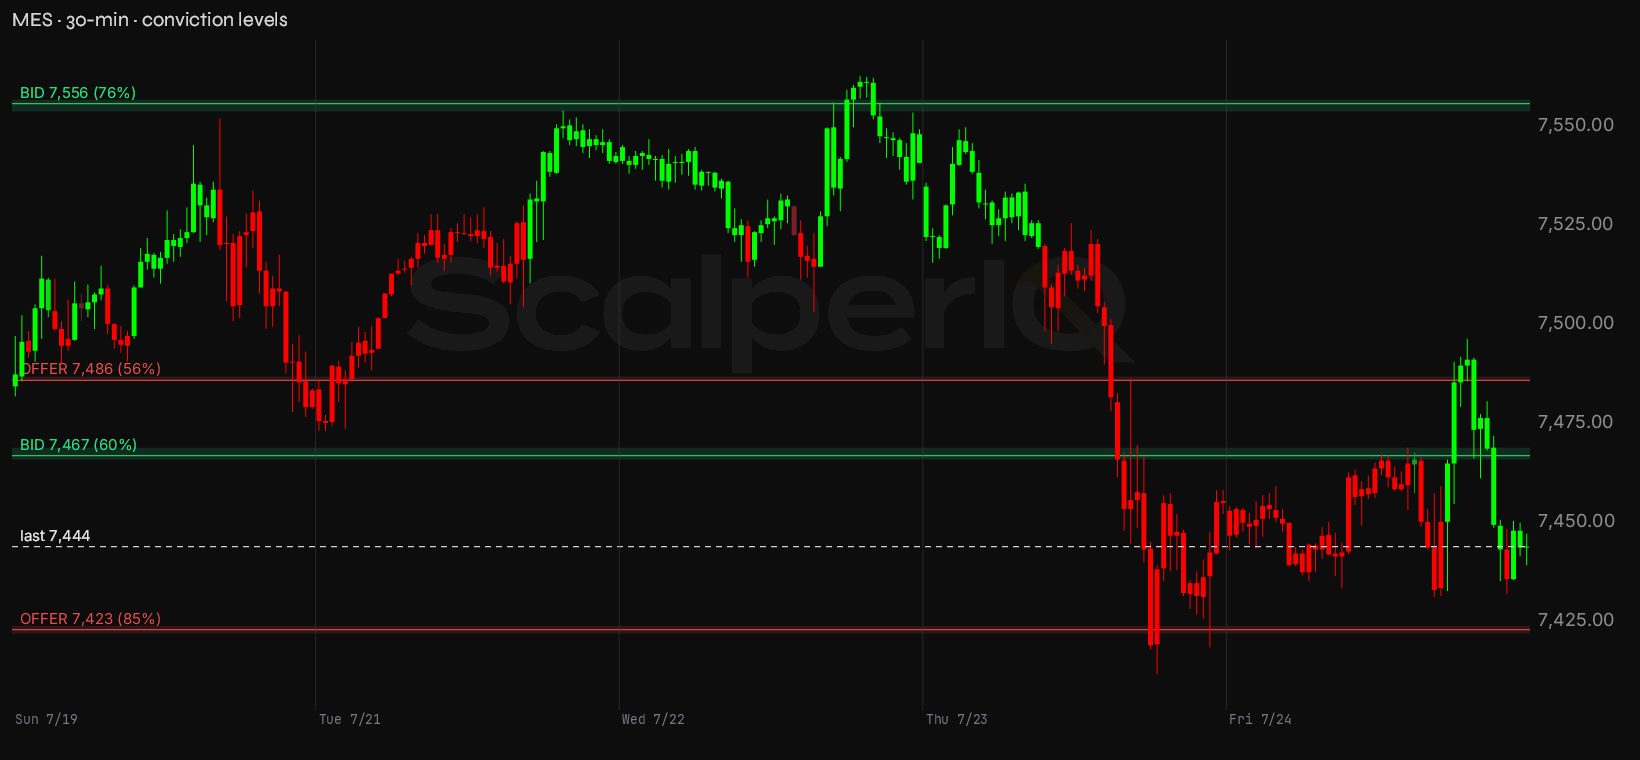
MES conviction zones
| Zone | Price | Read |
|---|---|---|
| Re-offer | 7,486 (7,486–7,487) | Supply shelf — 56% conviction. |
| Re-offer | 7,423 (7,422–7,424) | Supply shelf — 85% conviction. |
| Bid | 7,556 (7,554–7,557) | Demand cluster — 76% conviction. |
| Bid | 7,467 (7,466–7,469) | Demand cluster — 60% conviction. |
| Line in the sand | 7,412 | Last week's low — losing it is where I'd step back and reassess the bounce. |
MES closed at 7,444. The picture here is more nuanced. The 7,422–7,424 offer shelf at 7,423 is 21 points below the close — sellers were active there, and price is sitting just above it. That's the floor to watch: if MES slips through 7,423 on rising sell delta, there's not much weekly structure beneath it. Above the close, the 7,466–7,469 bid shelf at 7,467 is 23 points up (60% conviction — present but not dominant), the 7,486–7,487 offer shelf at 7,486 is 42 points above (56% conviction), and the 7,554–7,557 bid shelf at 7,556 sits 112 points above (76% conviction). MES has more structure surrounding current price than MNQ does — it's sitting between the 7,423 offer below and the 7,467 bid above, in a relatively tight band.
The one thing I need to see: a session where MNQ's net delta turns positive and price closes above the 28,712 offer shelf — buyers absorbing that supply and pushing through, not price floating up on thin volume while sellers wait.
On the Calendar
The scheduled risk worth timing around this week:
- Wednesday, July 29 — FOMC Rate Decision, 2:00 PM ET: Rate decision at 2:00 PM ET, press conference at 2:30 PM ET. Liquidity typically thins in the 30–60 minutes before the release. The sharpest order-flow swings on FOMC days often come during the Powell Q&A rather than the statement itself — the tape can gap on the decision and then reverse hard on a single answer.
- Thursday, July 30 — GDP (Advance, Q2 2026) + Initial Jobless Claims, 8:30 AM ET: Both print at the same time. GDP tends to gap the tape and whipsaw order flow for the first several minutes before delta settles into a direction. Claims are lower-impact most weeks but can amplify the GDP reaction if the number is elevated.
Bottom Line
Both instruments closed below every level that mattered last week, with MNQ carrying the heavier delta load at −33,267 on the week and −101,333 month-to-date. The sell-side lean is clear. Any bounce that doesn't reclaim the 28,712 offer shelf on positive net delta in MNQ is suspect — short covering, not new demand. MES is the relative strength tell: if MES starts losing the 7,423 zone on rising sell delta while MNQ can't get off the mat, the divergence that's been cushioning the broader index this month comes into question. Into the week of July 27, the bias is bearish until the tape proves otherwise.
* Conviction % — how one-sided the order flow was at that price. 100% means it traded essentially one direction; 50% means buyers and sellers fought it to a draw. It's a read on agreement, not size — a decisive level can still be a thin one.
* Delta means raw tick delta — executed buy volume minus sell volume, straight off the tape.
* MNQ / MES are the Micro E-mini Nasdaq-100 and S&P 500 futures — same index price action as the full-size NQ / ES, at a smaller contract size. We read the micros because they're where most retail order flow lives; the delta and volume figures here are micro-contract counts.
Delta Reads are my own read of the order flow — informational only, not financial advice and not a recommendation to buy or sell anything. Trading futures is not suitable for all persons: it carries a substantial risk of loss, and you can lose more than your initial investment. This is my interpretation of the data and it can contain errors — in the data, in the analysis, or both. Do your own due diligence and trade your own plan.

Get the Delta Reads
Our weekly order-flow read on MES and MNQ — what the tape did, and the levels we're watching next. One email a week. No noise.
See what ScalperIQ looks like on a live chart.
Try Free for 14 DaysNo credit card required in the US (outside the US, a card is required to start). Available on MotiveWave, EdgeProX, and NinjaTrader.