
Delta Read · Week of July 6, 2026 — MNQ Walked Into Monthly Supply on Thin Delta
Get the Delta Reads
Our weekly order-flow read on MES and MNQ — what the tape did, and the levels we're watching next. One email a week. No noise.
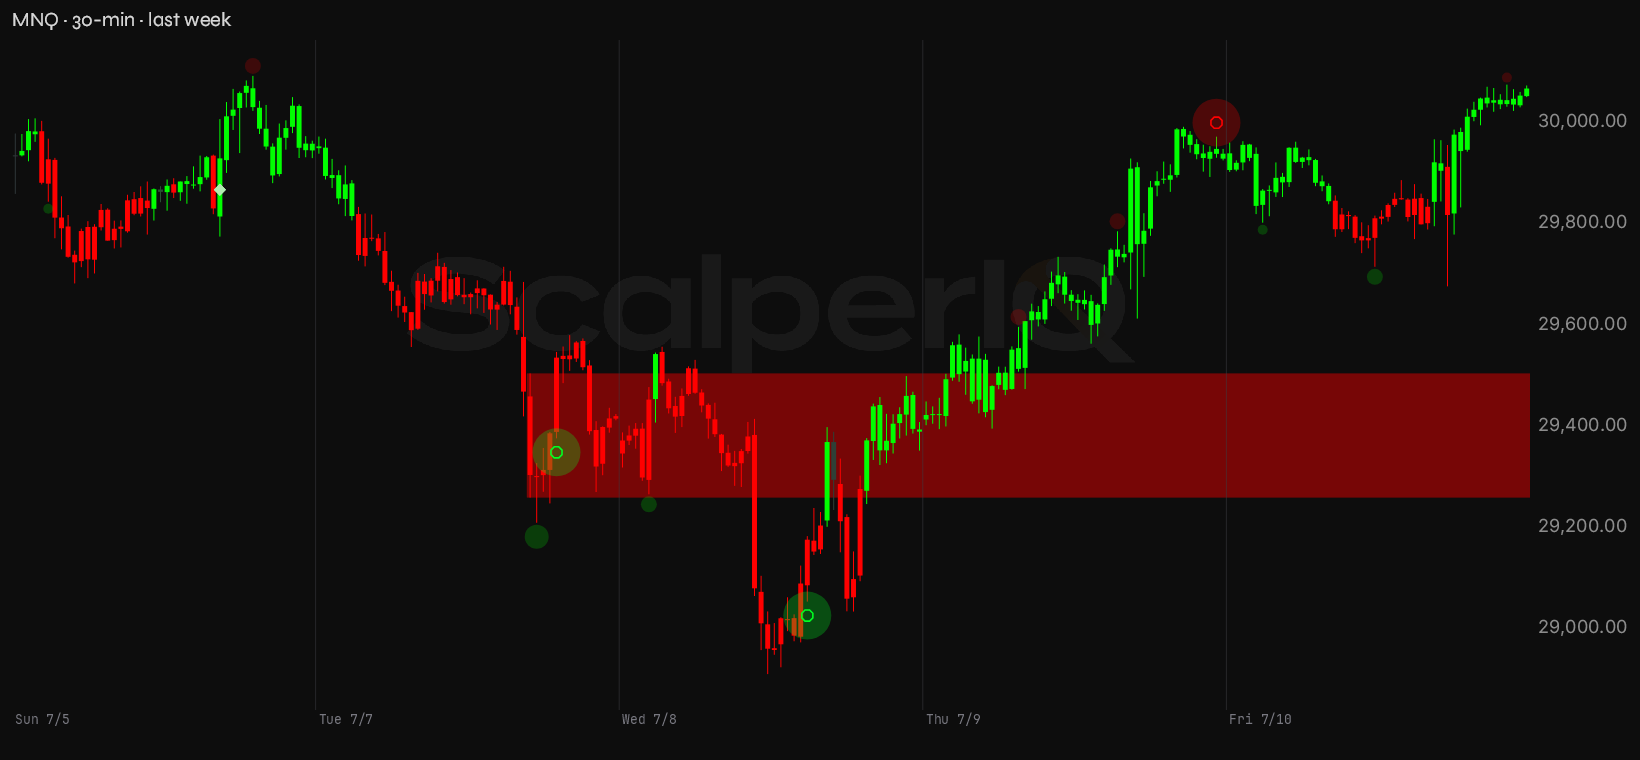
Last week's forward watch was specific: MNQ closing a full session above 30,158 with net delta positive — buyers lifting the offer through that level on a non-holiday session. That never happened, but the week didn't cooperate with a clean bearish read either. The prior neutral bias played out as mixed on both instruments — MES and MNQ both broke through every prior offer shelf on the way up, but MNQ's line in the sand at 29,274 got lost mid-week before price reversed and recovered. The levels gave way in both directions before the week was done.
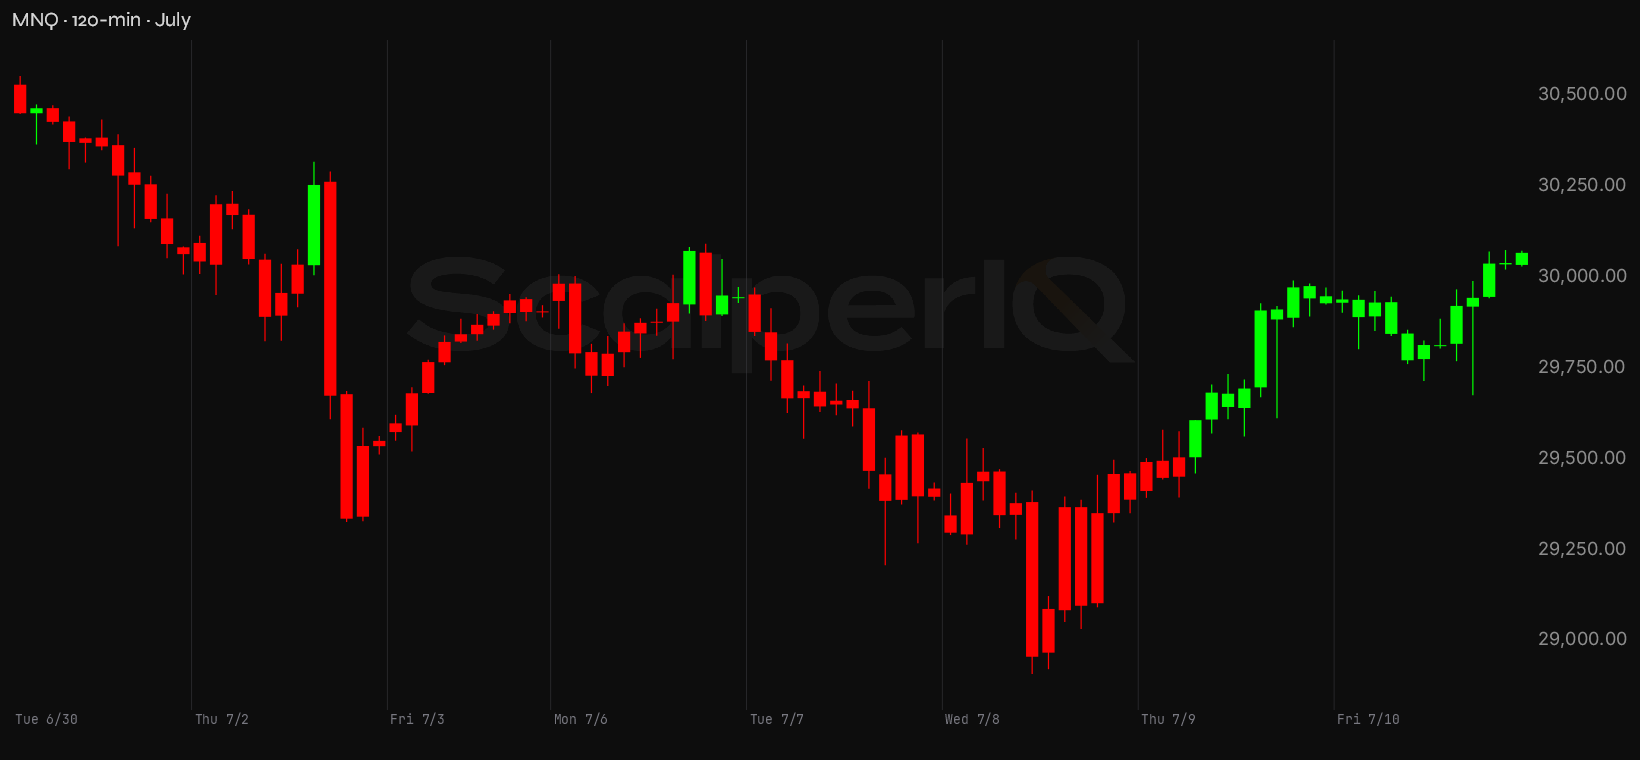
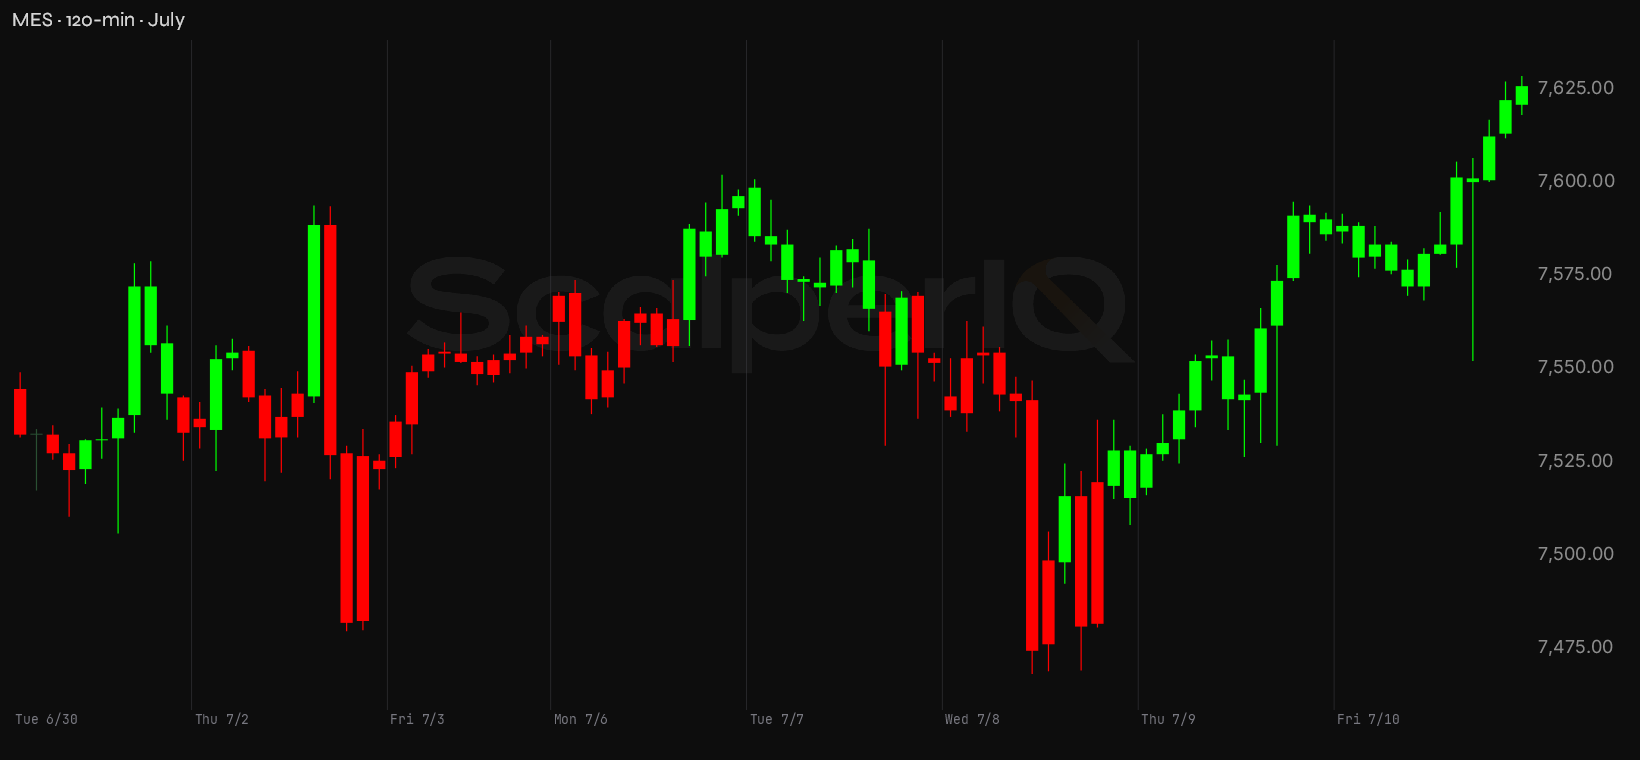
What the tape actually did was stranger than a clean resolution: MNQ dropped 1,183 points from Monday's high to Wednesday's low, then clawed every point back and closed the week at 30,069 — up 164 points from the prior Friday. MES ran the same script on a tighter range, closing at 7,626 after touching 7,468 mid-week. Price is back near the highs. Delta didn't fully pay for the trip.
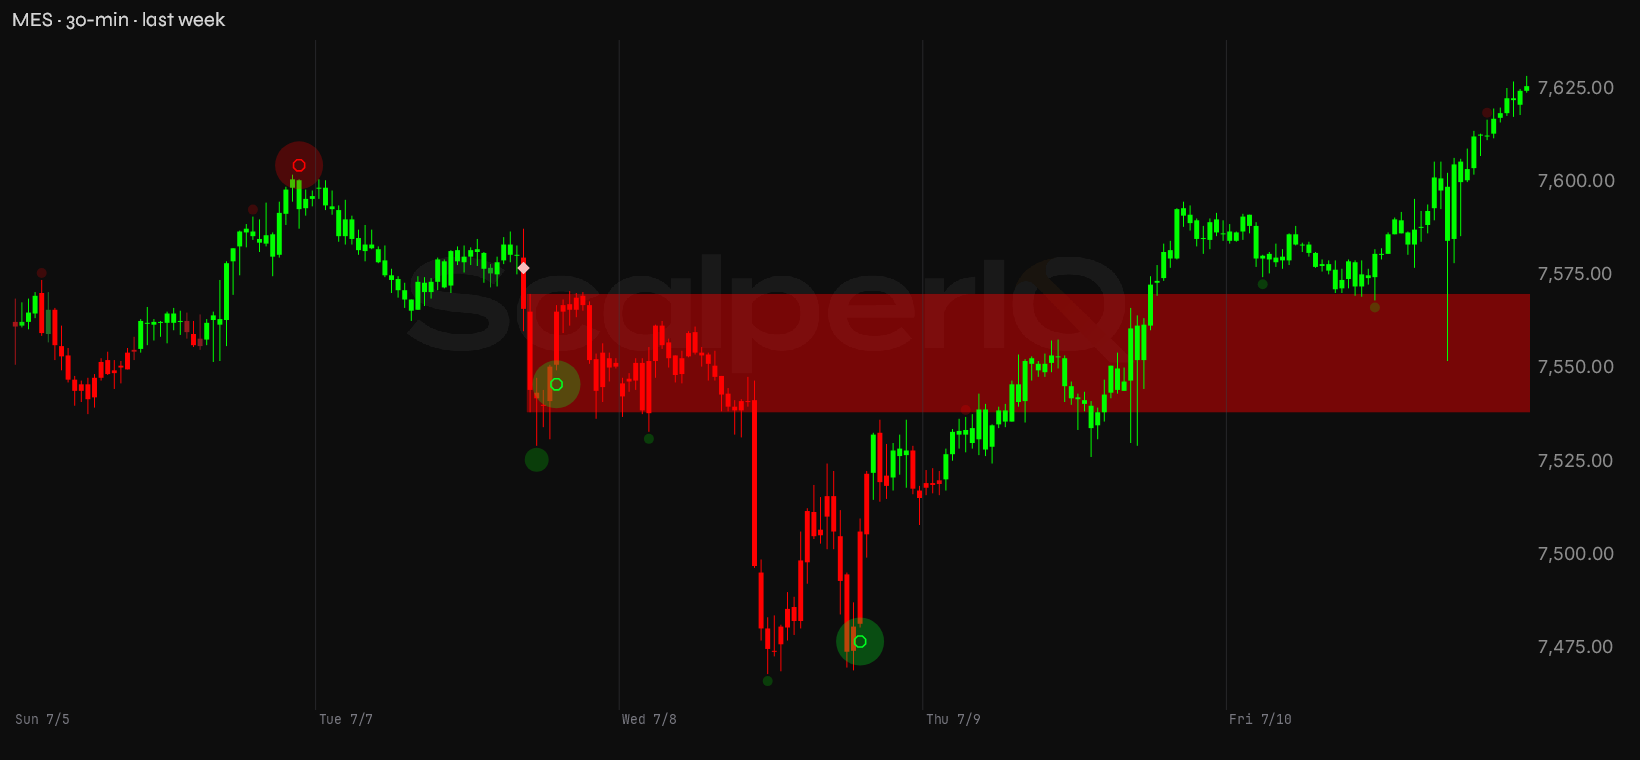
Quick version: both instruments closed the week at or near their highs, but MNQ's weekly net delta finished at −1,686 and MES scraped out only +2,455 on a 160-point round trip. The recovery looks strong on the chart; the order flow behind it is thinner than the price action suggests. The one thing that matters most: MNQ is now sitting just below a monthly supply shelf that's been defended at 86% conviction.
July Started With a Divergence Already Baked In
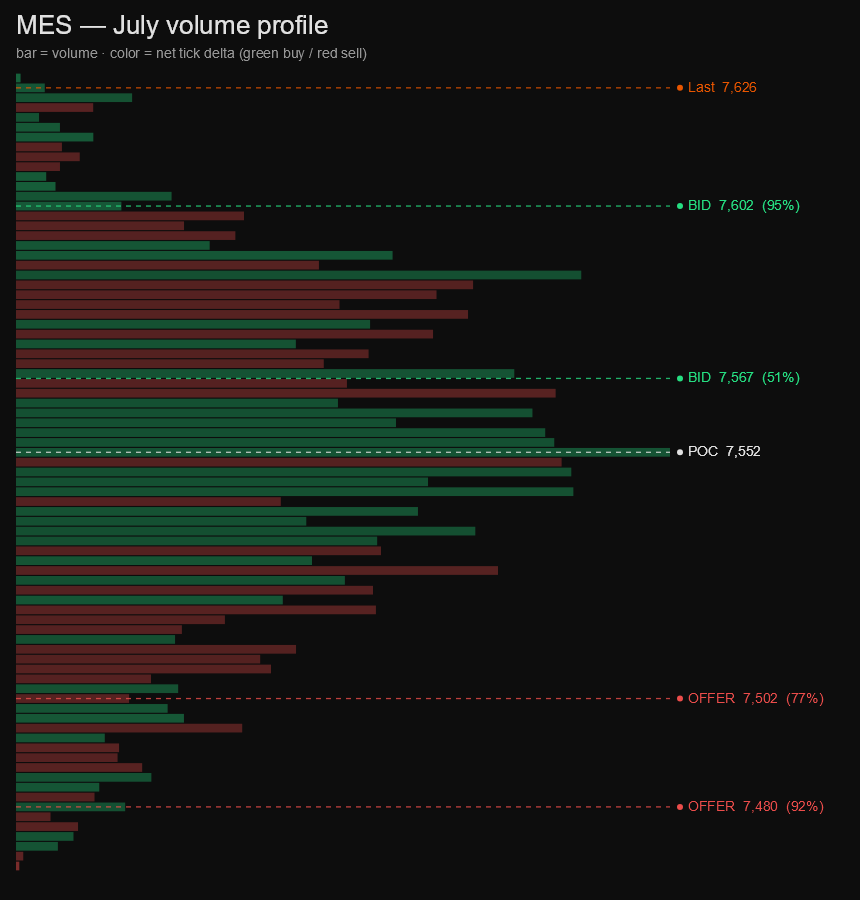
Month-to-date, the two instruments are telling different stories. MES has accumulated +9,998 net delta through the first week of July — buyers have been lifting the offer, and while that number isn't enormous, it's genuinely positive. The lean is constructive.
MNQ is the opposite. Month-to-date cumulative delta sits at −13,701 — sellers have been hitting the bid more aggressively than buyers have been lifting the offer, even as price pushed to a monthly high of 30,555 early in the period before pulling back to 28,910 at the low. That's a 1,645-point monthly range with a net-negative lean underneath it. The negative cumulative on MNQ isn't all fresh distribution — a chunk of that comes from the aggressive, stop-driven selling that tends to trade more urgently than the passive buying that floats price higher. But the lean is running heavier than a neutral month would suggest, and it's been that way since the first session.
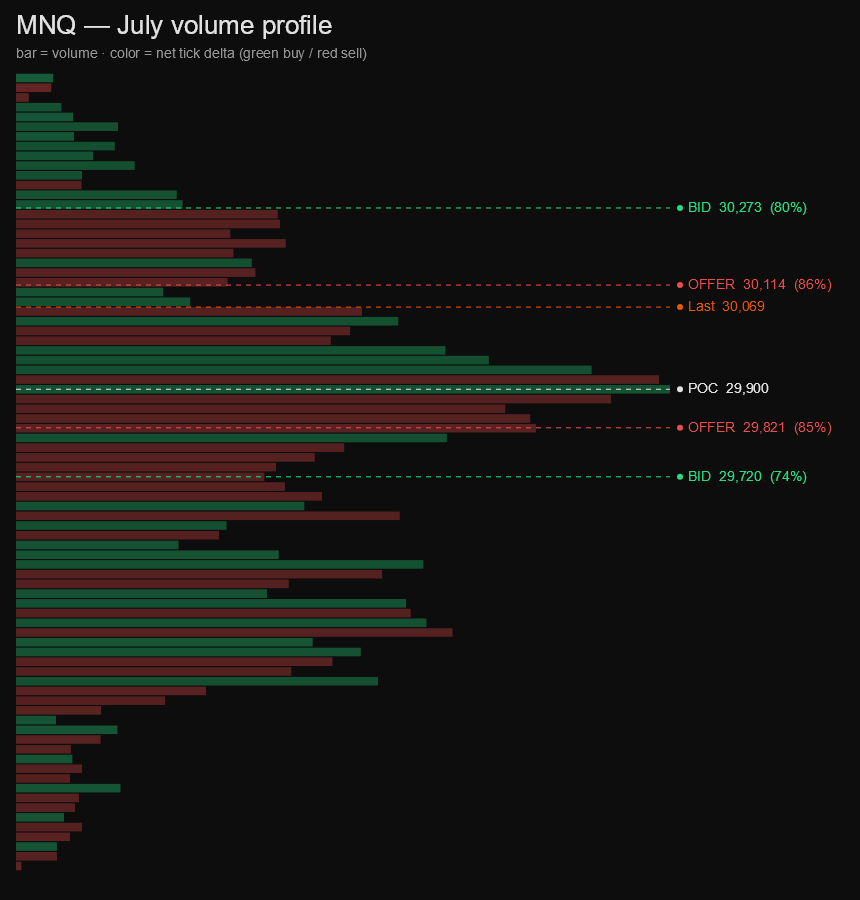
What that divergence means in practice: MES has been accumulating more quietly, buyers stepping in without urgency; MNQ has seen sharper two-sided action with the aggressive side leaning negative. When the two instruments split like this, MNQ tends to be the tell — it's where the institutional size moves faster and where the delta divergences print first. The fact that MNQ's cumulative delta is running negative while price sits near the top of its monthly range is the same setup that preceded the mid-week flush. Whether it resolves with another leg down or finally gets a genuine offer-lifting session is the question July still hasn't answered.
Last Week, Up Close
Monday, July 6 set the tone — and it was deceptive. MNQ opened at 29,937, tagged 30,094 (the week's high), then sold off to close at 29,947. Net delta on the session: −3,210. The high was a phantom — price pushed to a new weekly extreme, but the buying conviction wasn't there to hold it. MES ran the same script: −1,320 net delta, closed near the session high at 7,597 after fading off 7,602. Both instruments opened the week by printing their highs on negative delta.
Tuesday, July 7 was the real session. MNQ dropped 764 points — from 29,974 to a close of 29,421 — on −2,358 net delta. Sellers were hitting the bid all day, and price went with them. MES posted −3,013 delta on a 71-point range, closing at 7,552. The prior line in the sand on MNQ at 29,274 got tagged and briefly lost before the session closed above it — that's the "lost" verdict, and it's accurate: the level gave way intraday even though price recovered. Two sessions in, MNQ was down roughly 673 points from Monday's high and the delta was pointing lower.
Wednesday, July 8 is where it gets interesting. MNQ traded down to 28,910 — the week's low and the monthly low — on a 648-point range, but net delta flipped positive: +1,364. Sellers pushed price to a new extreme and ran out of gas at the low. MES printed the same signal: new weekly low at 7,468, but +1,194 net delta on the session. Selling dried up at the lows on both instruments simultaneously. That's the kind of print that earns attention.
Thursday, July 9 confirmed it. MNQ ran from 29,414 to close at 29,930 — a 535-point gain — on +1,796 net delta. Buyers were lifting the offer. MES posted +1,564 delta and closed at 7,586, recovering most of Tuesday's damage. The buying on Thursday had genuine delta behind it.
Friday, July 10 closed the week near the highs. MNQ finished at 30,069 on +722 delta — positive, but notably thinner than Thursday's session. MES closed at 7,626 on +4,030 delta, which was the strongest single-session delta of the week for the micros. The divergence on Friday is worth noting: MES's buyers were more aggressive into the close than MNQ's. Price on MNQ closed near the weekly high on shrinking delta — the same pattern that opened the week on Monday.
Levels I'm Watching
These come from our conviction zones, not lines drawn freehand — each level represents where order flow was persistently one-directional at a specific price.
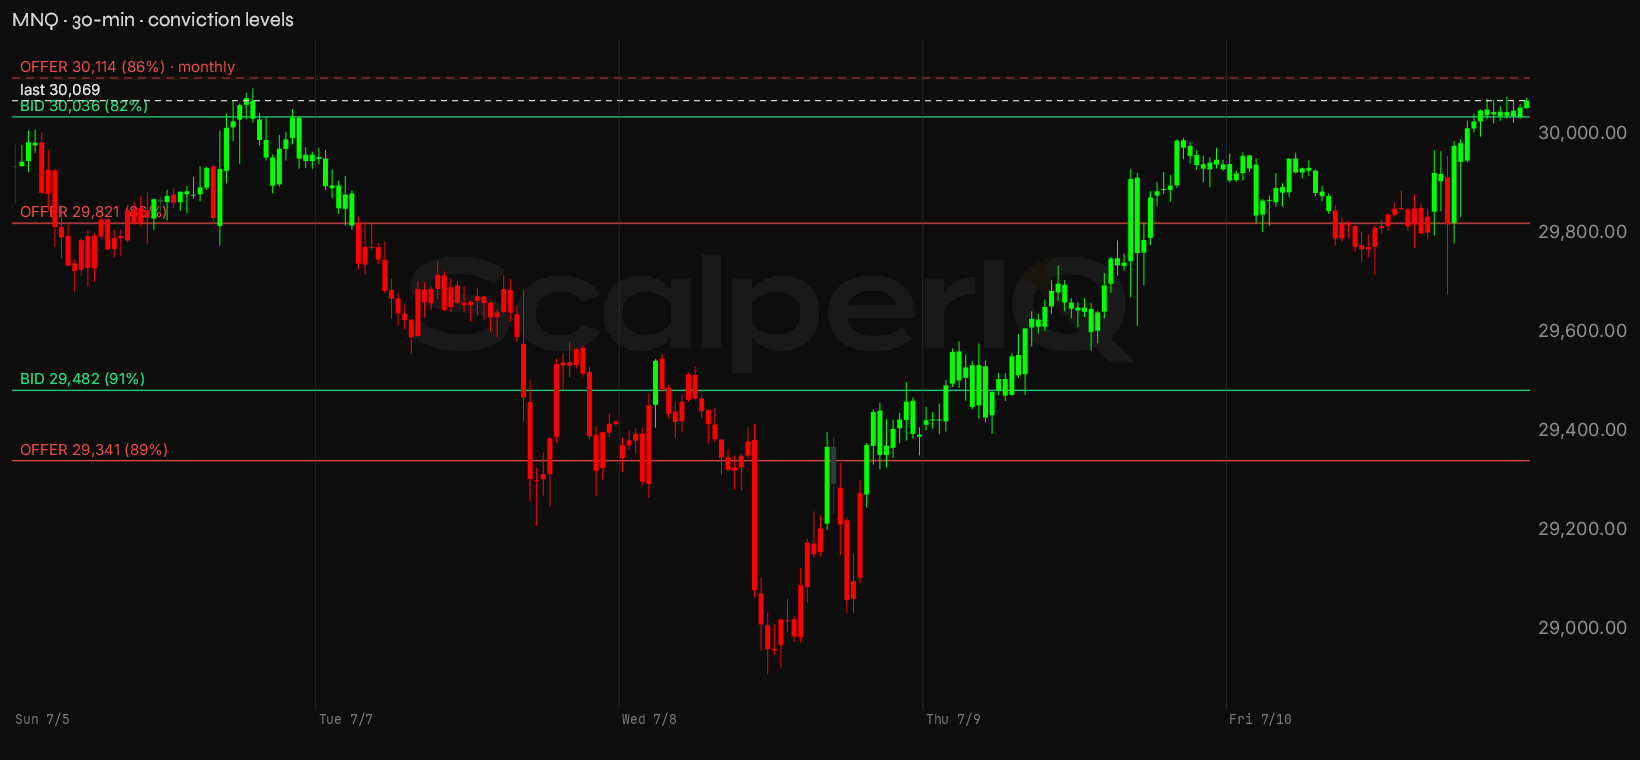
MNQ conviction zones
| Zone | Price | Read |
|---|---|---|
| Re-offer (monthly) | 30,110–30,119 | Supply shelf — 86% conviction. |
| Re-offer | 29,821–29,822 | Supply shelf — 86% conviction. |
| Re-offer | 29,339–29,344 | Supply shelf — 89% conviction. |
| Bid | 30,034–30,038 | Demand cluster — 82% conviction. |
| Bid | 29,481–29,486 | Demand cluster — 91% conviction. |
| Line in the sand | 28,910 | Last week's low — losing it is where I'd step back and reassess the bounce. |
MNQ closed Friday at 30,069. The nearest level above is the monthly supply shelf at 30,114–30,119 — just 45 points overhead, carrying 86% conviction with −2,311 net delta behind it. That level is above price per the data, and it's the one that matters most heading into next week. Above that, there's open air — no weekly structure overhead, just the monthly shelf standing between current price and the prior highs. Below price, the nearest support is the weekly bid shelf at 30,034–30,038, sitting 33 points back with 82% conviction and +1,611 net delta. Lose that and the next reference is the weekly offer-turned-support at 29,821 (−248 points, 86% conviction), then the weekly bid at 29,482–29,486 (−587 points, 91% conviction). The 29,341 area is the deepest weekly reference — 89% conviction, −728 points from Friday's close — and it's where Tuesday's selling was concentrated.
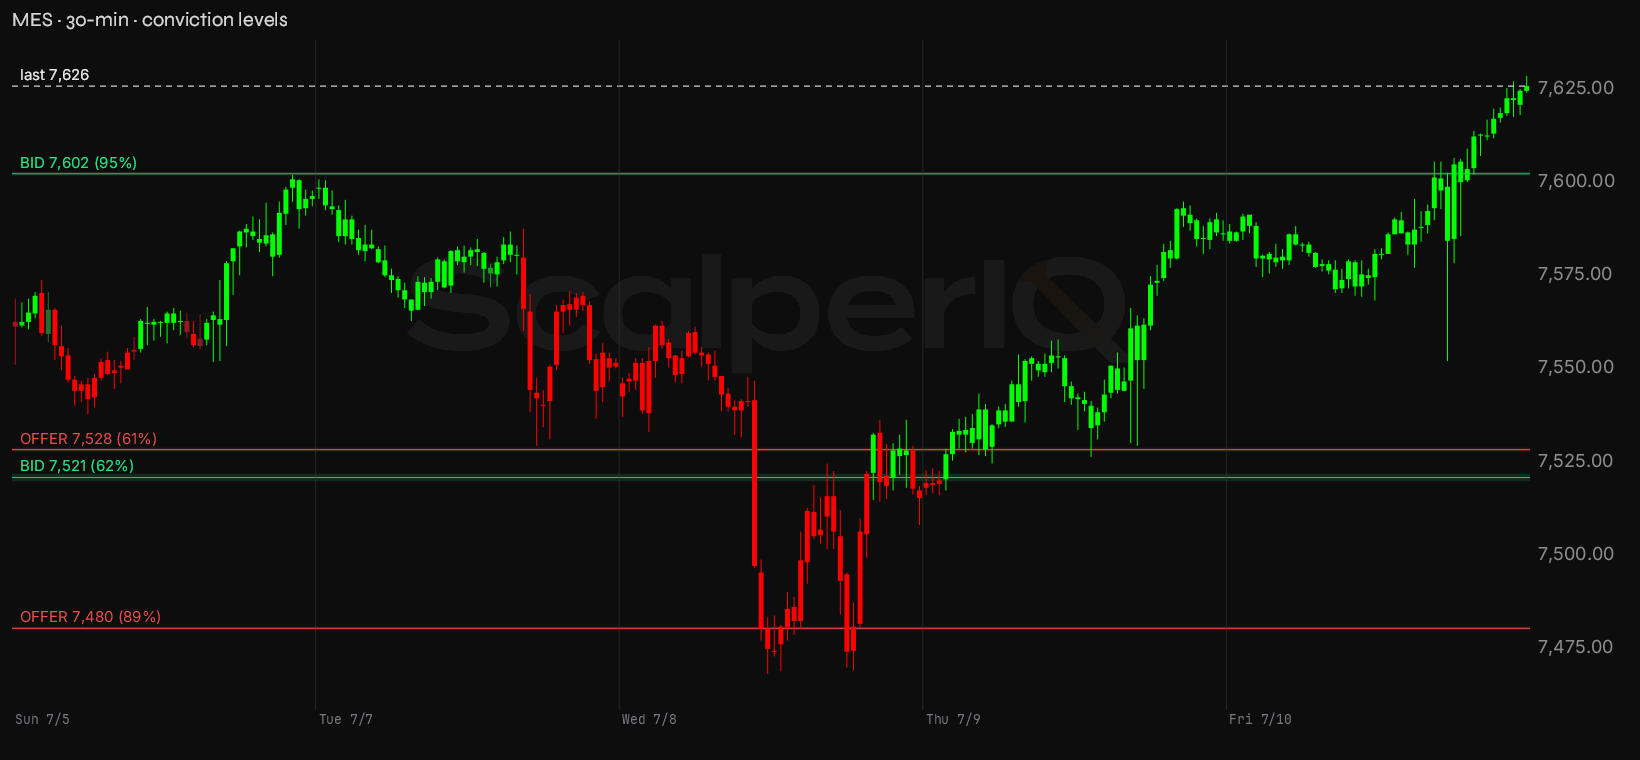
MES conviction zones
| Zone | Price | Read |
|---|---|---|
| Re-offer | 7,528–7,529 | Supply shelf — 61% conviction. |
| Re-offer | 7,480–7,481 | Supply shelf — 89% conviction. |
| Bid | 7,602–7,603 | Demand cluster — 95% conviction. |
| Bid | 7,520–7,522 | Demand cluster — 62% conviction. |
| Line in the sand | 7,468 | Last week's low — losing it is where I'd step back and reassess the bounce. |
MES closed at 7,626. All four weekly levels are below price. The nearest is the 7,602–7,603 bid shelf — just 24 points back, 95% conviction, +774 net delta. That's the first thing that needs to hold if the week's recovery is real. Below that: 7,528–7,529 offer shelf (−98 points, 61% conviction), the 7,520–7,522 bid shelf (−105 points, 62% conviction), and the 7,480–7,481 offer shelf (−146 points, 89% conviction). There's no weekly supply above current price on MES — above 7,626 it's open air on the weekly structure. The monthly supply on MNQ is the cap that matters for the complex.
The one thing I need to see: MNQ closing a session above 30,119 — through that monthly supply shelf — on positive net delta. Until that happens, the recovery from Wednesday's low is a bounce into resistance, not a breakout.
On the Calendar
The scheduled risk worth timing around this week:
- Tuesday, July 14 — CPI (Jun 2026 data), 8:30 AM ET. The tape runs thin and jumpy into the print, and the first spike off the number is usually noise before delta settles into a direction. Both MNQ and MES can gap several hundred points on a surprise; the order flow read matters more in the minutes after than in the first reaction.
- Wednesday, July 15 — PPI (Jun 2026 data), 8:30 AM ET. A day after CPI, this one typically moves less, but back-to-back inflation prints can keep the tape unsettled through mid-week. Think of it as the volatility staying warm rather than resetting.
- Thursday, July 16 — Retail Sales (Jun 2026 data) and Initial Jobless Claims, both 8:30 AM ET. Two prints hitting simultaneously. Retail Sales can swing MES and MNQ several points in the first minute; Claims is lower-impact most weeks but can add to the noise when the number is out of range.
Three consecutive 8:30 AM prints Tuesday through Thursday means the pre-market window will be thin most of the week. The back half of the week — once Thursday's data is through — tends to be where cleaner order flow reads emerge.
Bottom Line
The recovery off Wednesday's low was real — delta confirmed the turn on both MES and MNQ — but the week closed with MNQ sitting just below monthly supply at 30,114–30,119 on shrinking Friday delta. The bias is cautiously long while the 7,602 bid shelf on MES and the 30,034 bid shelf on MNQ hold, but those levels are close enough that a single weak session tests them immediately. MNQ is the instrument that leads if this works — a session where it clears 30,119 on positive delta would be the first genuine breakout signal of the month. If instead MNQ rolls over from the monthly supply shelf and MES loses 7,602 on rising sell delta, the Wednesday low comes back into play and the bounce loses its footing.
* Conviction % — how one-sided the order flow was at that price. 100% means it traded essentially one direction; 50% means buyers and sellers fought it to a draw. It's a read on agreement, not size — a decisive level can still be a thin one.
* Delta means raw tick delta — executed buy volume minus sell volume, straight off the tape.
* MNQ / MES are the Micro E-mini Nasdaq-100 and S&P 500 futures — same index price action as the full-size NQ / ES, at a smaller contract size. We read the micros because they're where most retail order flow lives; the delta and volume figures here are micro-contract counts.
Delta Reads are my own read of the order flow — informational only, not financial advice and not a recommendation to buy or sell anything. Trading futures is not suitable for all persons: it carries a substantial risk of loss, and you can lose more than your initial investment. This is my interpretation of the data and it can contain errors — in the data, in the analysis, or both. Do your own due diligence and trade your own plan.

Get the Delta Reads
Our weekly order-flow read on MES and MNQ — what the tape did, and the levels we're watching next. One email a week. No noise.
See what ScalperIQ looks like on a live chart.
Try Free for 14 DaysNo credit card required in the US (outside the US, a card is required to start). Available on MotiveWave, EdgeProX, and NinjaTrader.