
Delta Read · Week of June 29, 2026 — Price Bounced, Delta Didn't Follow
Get the Delta Reads
Our weekly order-flow read on MES and MNQ — what the tape did, and the levels we're watching next. One email a week. No noise.
Last week's forward watch was one concrete thing: a session on MNQ where price closes higher and net delta exceeds +5,000 — genuine offer-lifting, not short covering. It never came. MNQ's weekly net delta came in at −5,923, and the delta direction that deepened week after week through June kept its character right into the final trading days of the month. ES told a similar story from a different angle — net delta was essentially flat at −107 for the week, but that near-zero figure masked a week of tug-of-war, not resolution.
Here's the full week through the ScalperIQ engine, MNQ first:
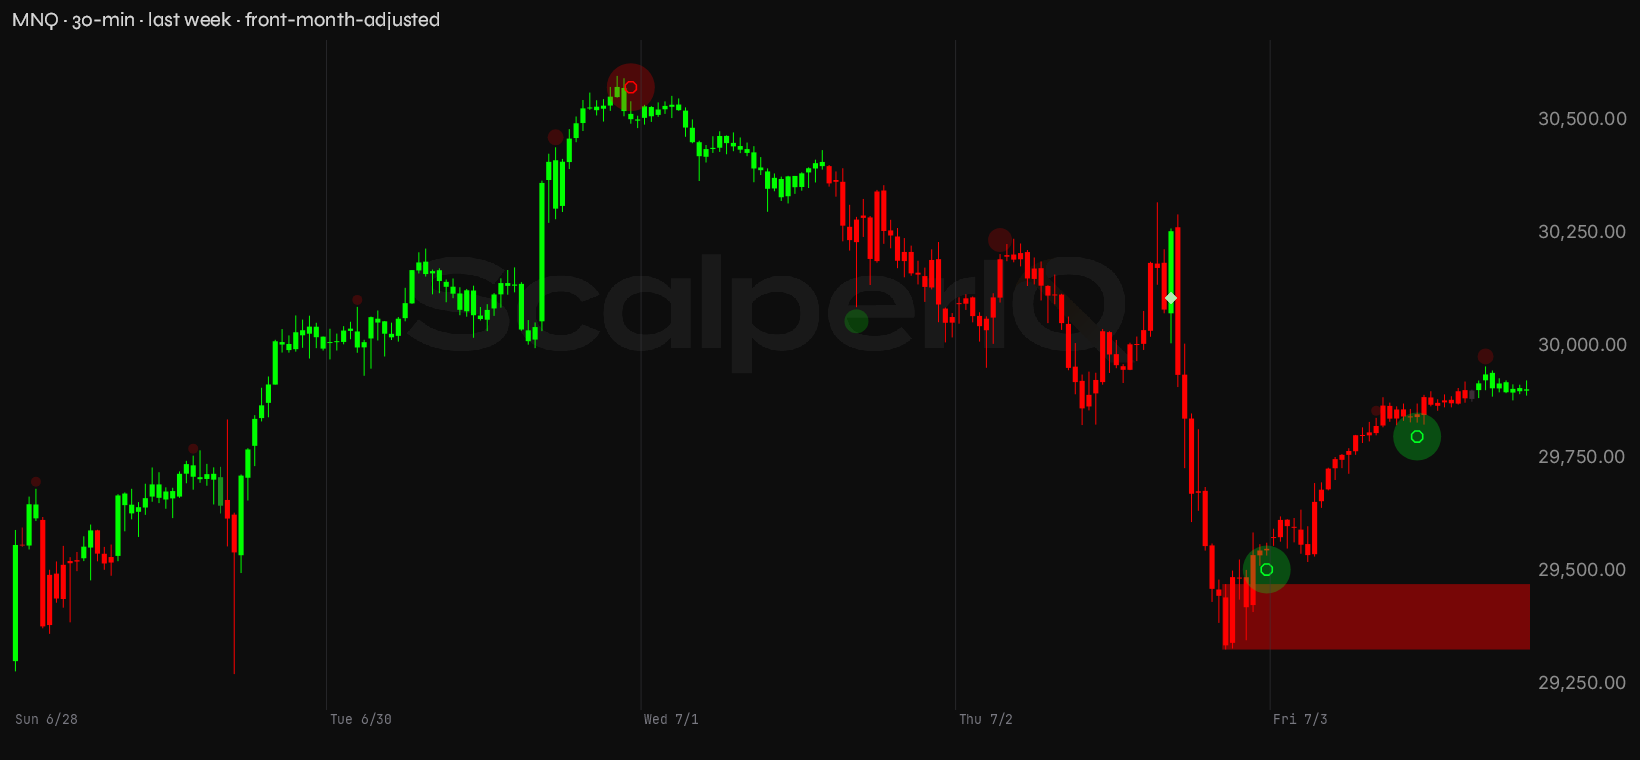
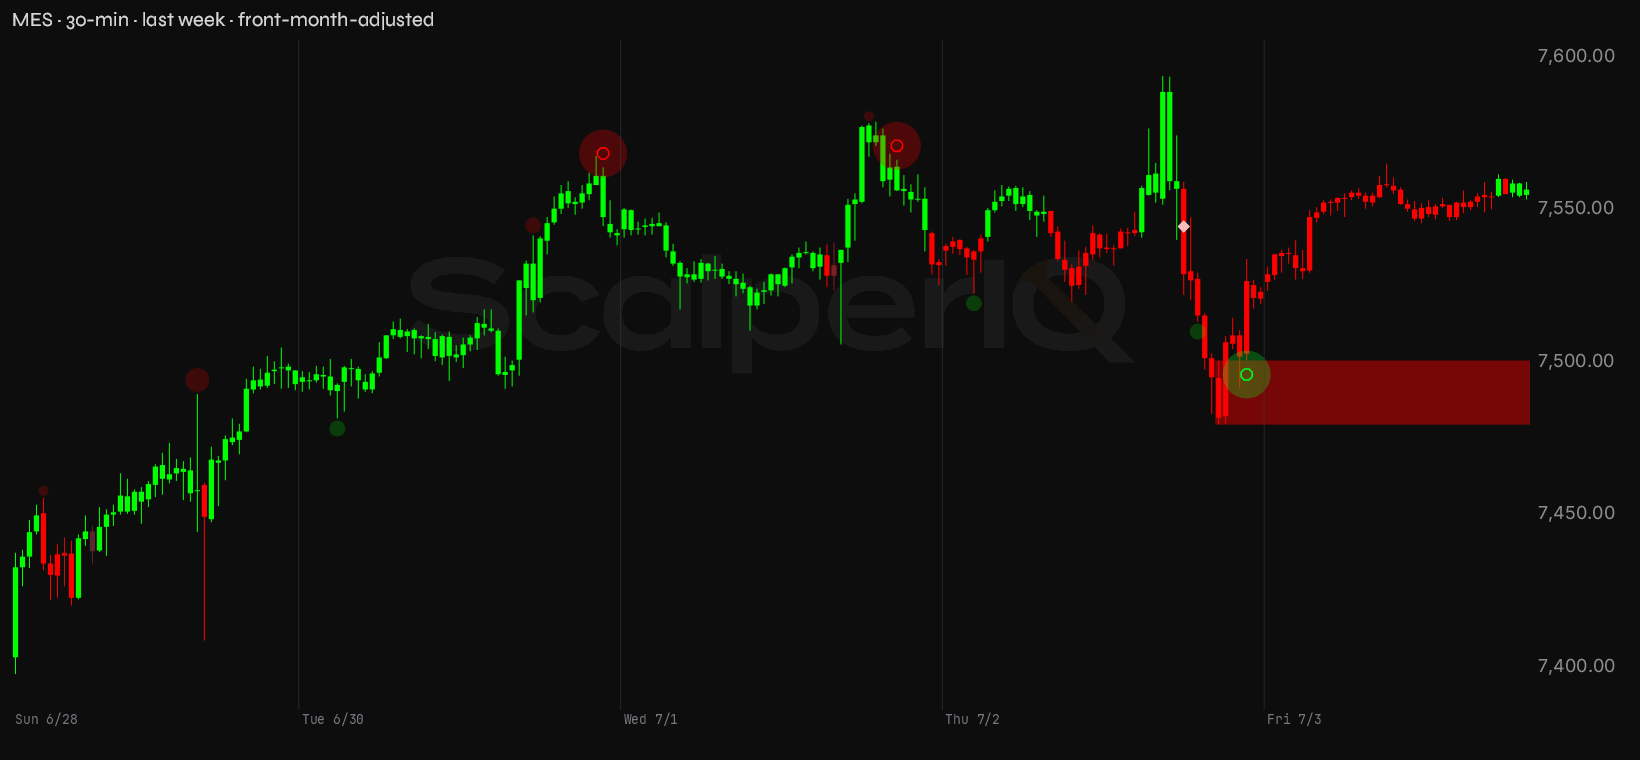
MNQ closed Friday at 29,905.25 — a 1,326-point range across the week with the tape spending most of its time hitting the bid. MES closed at 7,556.75 after carving a 196-point range that looked more controlled but carried the same undercurrent.
Quick version: the bias is neutral, the bounce off Monday's low was real but fragile, and the one thing that matters most heading into the week of July 6 is whether buyers can show up with delta that actually lifts the offer.
The month set the trap
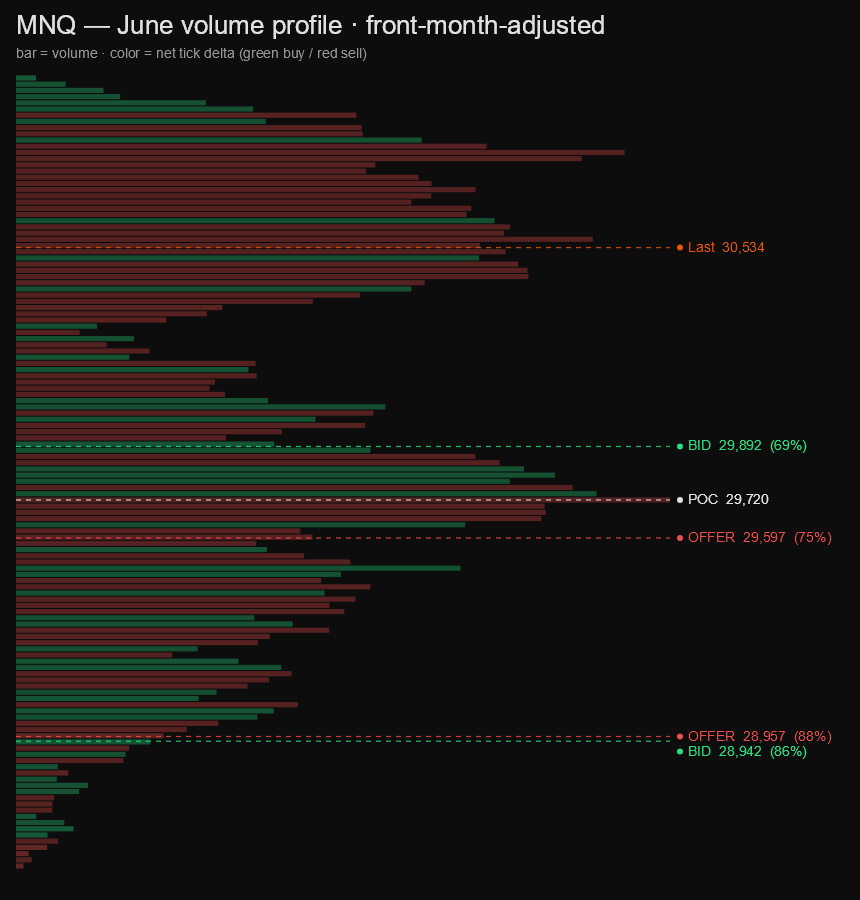
June played out as a month where price moved in both directions with conviction, but the order flow underneath told a quieter, more consistent story. MNQ's cumulative delta for June finished at −87,815 — net delta ran negative all month. That number sounds alarming, but the framing matters: down-moves trade aggressively (stops firing, urgency, panic), while the buying that floats price higher tends to be passive and absorbed rather than aggressive offer-lifting. A structurally negative cumulative is the baseline. What makes June notable is how much heavier that lean ran compared to a typical month — the tape was hitting the bid with more persistence than usual, not just the mechanical skew.
MES reinforced the same picture. Cumulative delta for June came in at −18,950 — the lean was consistent with MNQ's, just scaled to the instrument. Both instruments spent the month in a 2,580-point (NQ) and 400-point (ES) range, touching highs early and spending the back half of June working back from them.
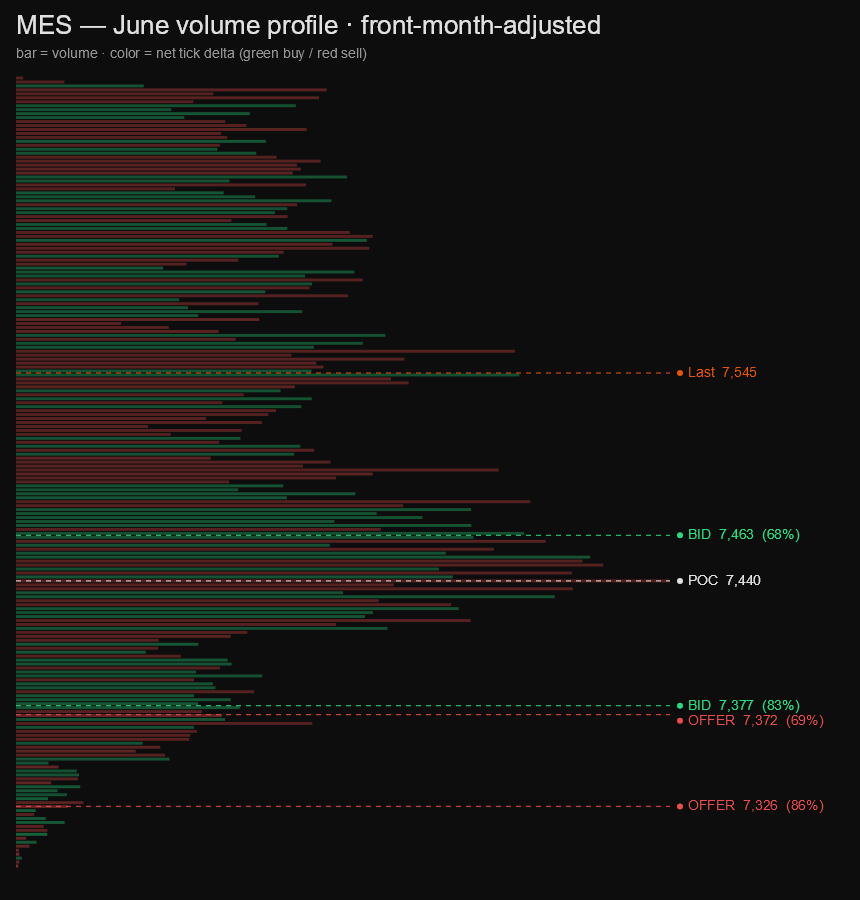
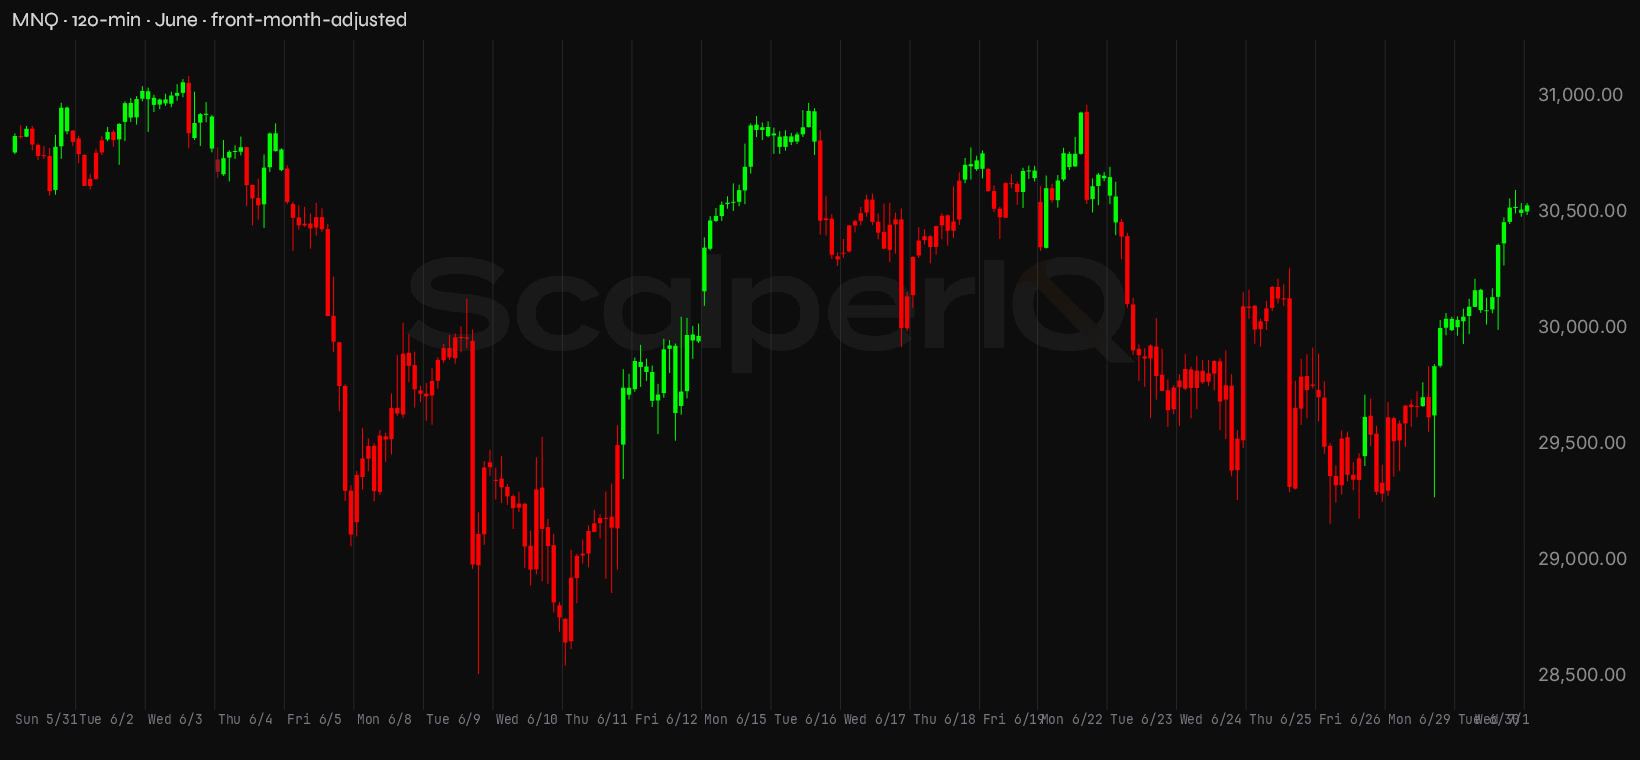
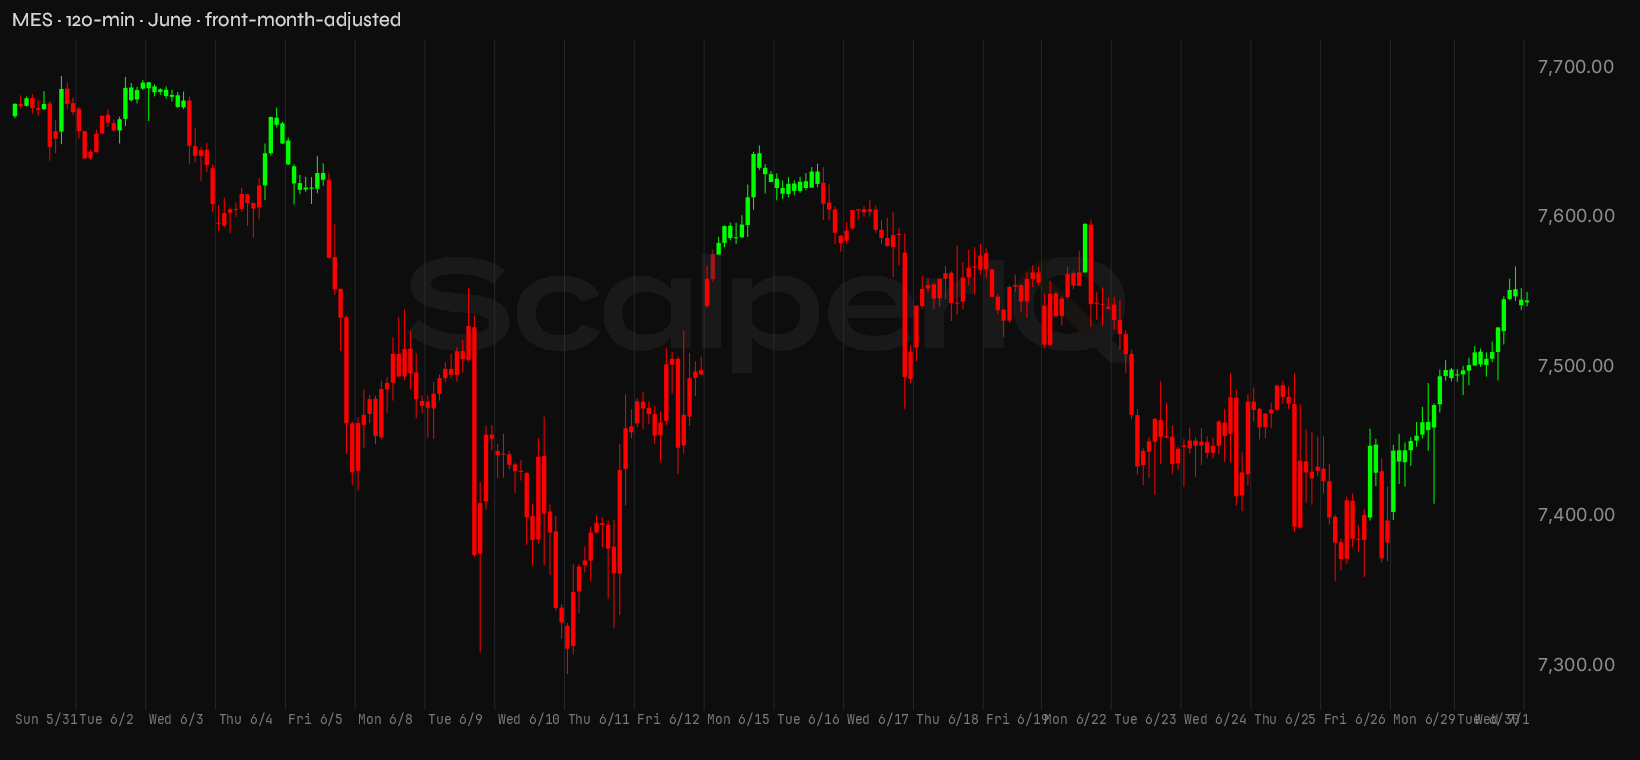
The divergence worth noting: on the sessions where price recovered, the cumulative delta barely moved — buyers weren't lifting the offer to get long, they were stepping in passively or the sellers were simply pausing. That's a distribution character, not accumulation. A genuine accumulation month leaves positive delta clusters at the lows — buyers getting aggressive when price is cheap. June didn't show that. Both instruments closed the month below their highs with the delta lean still pointing down.
Last week, up close
Monday, June 29 was the session that set the week's tone — and the two instruments read it differently. MNQ opened at 29,302 and printed +5,364 net delta on the day, closing at 29,995.50 after a 795-point range. That's the closest thing to a genuine buying session MNQ had all week — price up, delta positive, buyers lifting the offer. ES told the opposite story on the same day: −6,039 net delta, and the session closed green anyway. Sellers were hitting the bid in ES while buyers were lifting the offer in MNQ. That divergence is worth flagging — when the two instruments split like that, it's not a clean signal either way.
Tuesday, June 30 is where things got interesting. MNQ ran another 664 points to the upside, tagging 30,600 — the week's high — but net delta came in at just −108. Price up 500 points, delta essentially zero, engine showing red. That's a phantom-style move: the advance happened without aggressive buyers showing up to pay for it. Short covering and passive absorption can move price, but they don't leave positive delta. ES on the same day printed −1,557 net delta while also closing higher, at 7,541.75. Both instruments at their weekly highs, both printing negative delta. The tape was telling you something.
Wednesday, July 1 confirmed it. MNQ reversed hard — opened at 30,507 and dropped to 30,009 by the close, −5,009 net delta, engine red. ES held up better on the day (+7,910 net delta, the week's standout positive session), closing at 7,533 — buyers were genuinely lifting the offer in ES while MNQ was getting sold. Again, a split read, but the MNQ story was the more important one given its role as the leading instrument.
Thursday, July 2 was the week's ugliest session. MNQ dropped 991 points intraday — from 30,319 at the high to 29,328 at the low — and closed at 29,551 with −5,443 net delta. Sellers were running the tape. ES saw a similar breakdown: 114 points of range, −1,151 net delta, closing at 7,523.
Friday, July 3 was the July 4th holiday early close — CME equity-index futures shut down at 12:00 PM CT. MNQ recovered 433 points off the Thursday low, closing at 29,905.25, but net delta was −727 and the engine stayed red. ES added 33 points to close at 7,556.75 with +730 net delta. The thin, abbreviated session means Friday's numbers are holiday-session noise — the morning's recovery looks constructive on a chart, but the flow was too light to read as genuine conviction. Don't weight it.
The real session was Tuesday's phantom advance to 30,600. The suspect one was every session after it.
Levels I'm watching
These come from our conviction* zones — price levels where the engine found one-directional order flow, not lines drawn freehand.
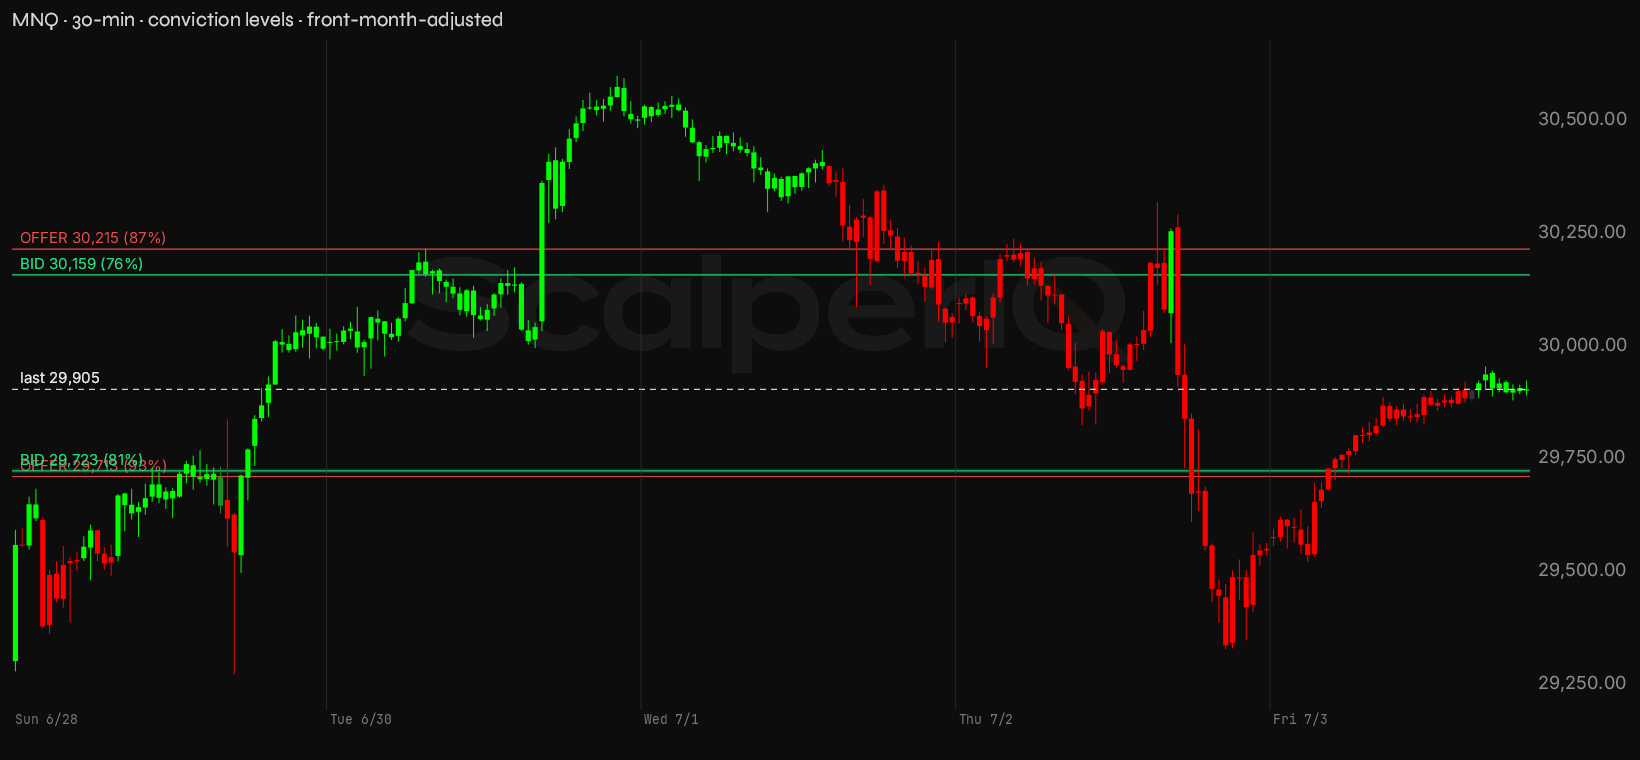
MNQ closed the week at 29,905.25. Here's what the engine mapped:
MNQ conviction zones
| Zone | Price | Read |
|---|---|---|
| Re-offer | 30,214–30,218 | Supply shelf — 87% conviction. |
| Re-offer | 29,710–29,714 | Supply shelf — 93% conviction. |
| Bid | 30,156–30,162 | Demand cluster — 76% conviction. |
| Bid | 29,719–29,730 | Demand cluster — 81% conviction. |
| Line in the sand | 29,274 | Last week's low — losing it is where I'd step back and reassess the bounce. |
Below current price, there are two levels sitting close together — a selling zone at 29,712 (93% conviction, −1,286 net delta, 193 points below the close) and a buying zone at 29,722 (81% conviction, +2,996 net delta, 182 points below). That cluster is a contested area: sellers hit the offer there, buyers leaned on the bid at nearly the same price. A pullback into that 29,710–29,730 band will be the first real test — does the bid shelf hold, or do sellers clear it? Above current price, the nearest level is the weekly buying zone at 30,158 (76% conviction, 253 points above), followed by a selling zone at 30,215 (87% conviction, −2,347 net delta, 310 points above). Above 29,905, it's relatively open air until that 30,158 bid shelf, and above that the 30,215 offer zone is sitting right on top of it — a tight ceiling if price gets there.
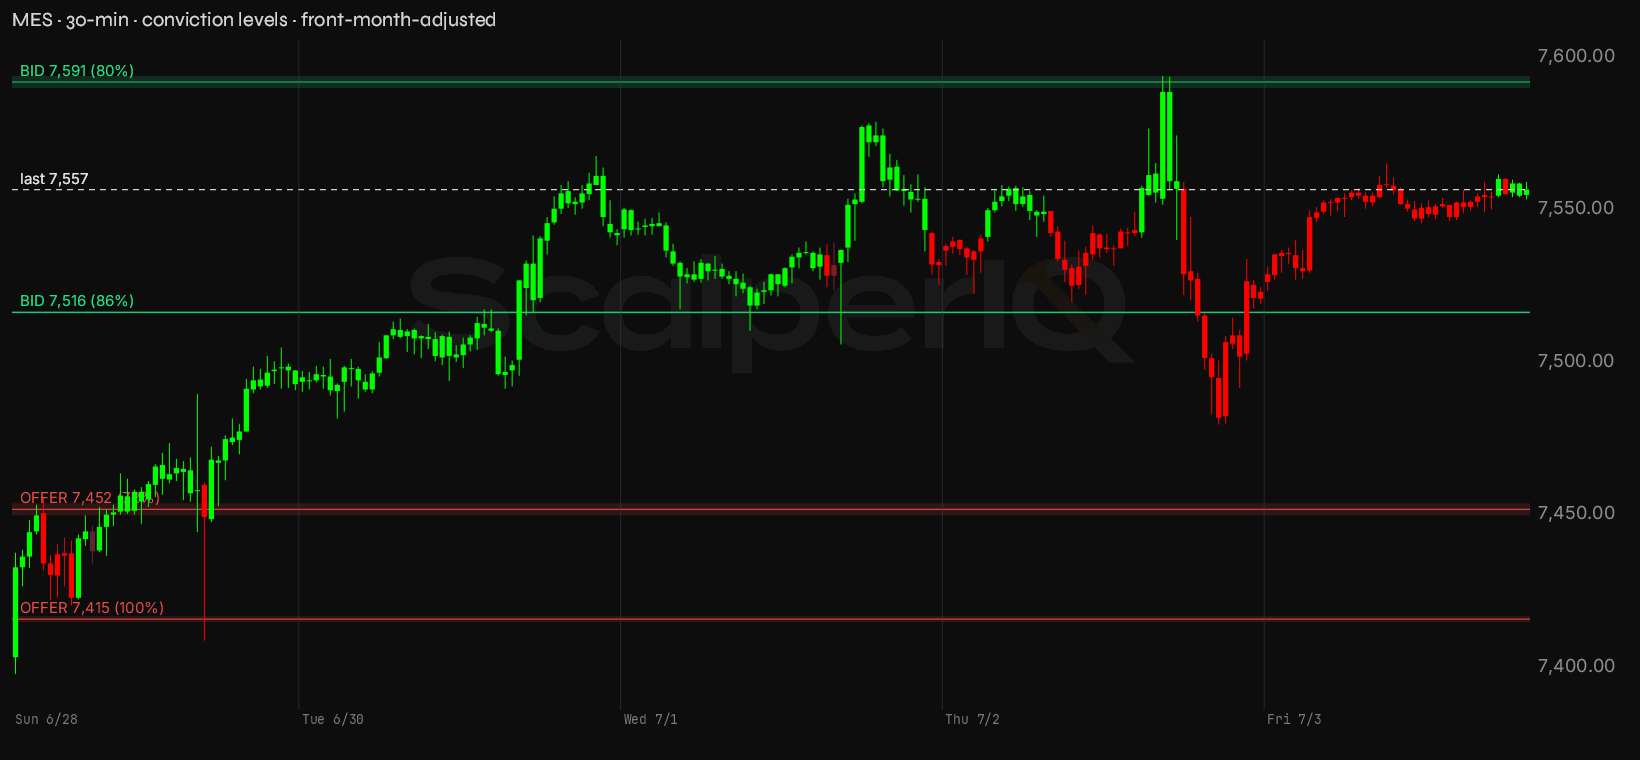
MES closed the week at 7,556.75. Here's the picture:
MES conviction zones
| Zone | Price | Read |
|---|---|---|
| Re-offer | 7,450–7,454 | Supply shelf — 72% conviction. |
| Re-offer | 7,415–7,417 | Supply shelf — 100% conviction. |
| Bid | 7,590–7,594 | Demand cluster — 80% conviction. |
| Bid | 7,516–7,517 | Demand cluster — 86% conviction. |
| Line in the sand | 7,398 | Last week's low — losing it is where I'd step back and reassess the bounce. |
Below current price, two selling zones: the weekly offer at 7,516 (86% conviction, +1,175 net delta — note this is a buying shelf, 41 points below the close), and further down the weekly offer at 7,451 (72% conviction, −1,323 net delta, 105 points below) and 7,415 (100% conviction, −450 net delta, 141 points below). The 7,516 level is the most relevant near-term support — a buying zone 41 points under the close. Lose that and the next meaningful structure is the 7,451 area. Above price, the weekly buying zone at 7,591 (80% conviction, +1,287 net delta) sits 35 points above the close — that's the first ceiling. The close is sandwiched: 41 points of air to support, 35 points to resistance. Tight range with clearly defined edges.
The one thing I need to see: MNQ closing a full session above 30,158 with net delta positive — buyers lifting the offer through that level, not just price floating up on thin volume.
On the calendar
The scheduled risk worth timing around this week:
- Thursday, July 9 — Initial Jobless Claims, 8:30 AM ET: Most weeks this is background noise, but an elevated reading tends to thin the book ahead of the number and widen ranges on the print. Into 8:30 the tape can go quiet; the first move off the number is often the noisiest part.
(No macro events printed last week during the analyzed period — Friday's early close was the holiday, not a data release.)
Bottom line
The bias into the week of July 6 is neutral with a cautious lean toward the downside. MNQ's weekly delta stayed negative for the fourth consecutive week, and the one session that looked like genuine buying — Monday's +5,364 — was immediately followed by three days of sellers running the tape. The bounce off Thursday's low into Friday's abbreviated session hasn't been confirmed by delta. MNQ is the tell on both sides: if buyers show up and lift the offer through 30,158 on a full session's worth of positive delta, the bounce earns credibility. If sellers retest the 29,710–29,730 cluster and the bid there gives way on rising sell delta, the recovery comes into serious question.
* Conviction % — how one-sided the order flow was at that price. 100% means it traded essentially one direction; 50% means buyers and sellers fought it to a draw. It's a read on agreement, not size — a decisive level can still be a thin one.
* Delta means raw tick delta — executed buy volume minus sell volume, straight off the tape.
* MNQ / MES are the Micro E-mini Nasdaq-100 and S&P 500 futures — same index price action as the full-size NQ / ES, at a smaller contract size. We read the micros because they're where most retail order flow lives; the delta and volume figures here are micro-contract counts.
Delta Reads are my own read of the order flow — informational only, not financial advice and not a recommendation to buy or sell anything. Trading futures is not suitable for all persons: it carries a substantial risk of loss, and you can lose more than your initial investment. This is my interpretation of the data and it can contain errors — in the data, in the analysis, or both. Do your own due diligence and trade your own plan.
Get the Delta Reads
Our weekly order-flow read on MES and MNQ — what the tape did, and the levels we're watching next. One email a week. No noise.
See what ScalperIQ looks like on a live chart.
Try Free for 14 DaysNo credit card required. Available on MotiveWave, EdgeProX, and NinjaTrader.