
Delta Read · Week of June 22, 2026 — 1,800 Points Down, Delta Never Agreed to the Bounce
Get the Delta Reads
Our weekly order-flow read on MES and MNQ — what the tape did, and the levels we're watching next. One email a week. No noise.
Last week's forward watch was simple: one session on MNQ where price closes higher and net delta is positive — the first genuine buying confirmation. That session never came. MNQ's delta direction not only stayed negative, it deepened: −34,398 on the week versus −22,864 the week prior. ES flipped the other way — net delta swung to +27,803, a sharp reversal from −7,620 — but price on ES still closed lower on the week. Two instruments, two different delta stories, and neither one gave us a clean bullish confirmation. The roll is still in the data window (more on that below), so price levels don't carry over from last week's read, but the delta direction carries over clearly: MNQ kept selling.
Here's the quick version: the tape broke down hard on MNQ, ES absorbed better but still couldn't hold its highs, and going into the week of June 29 almost every conviction level sits above where price closed. That's not a setup — it's a map of what needs to be reclaimed.
The month set the trap
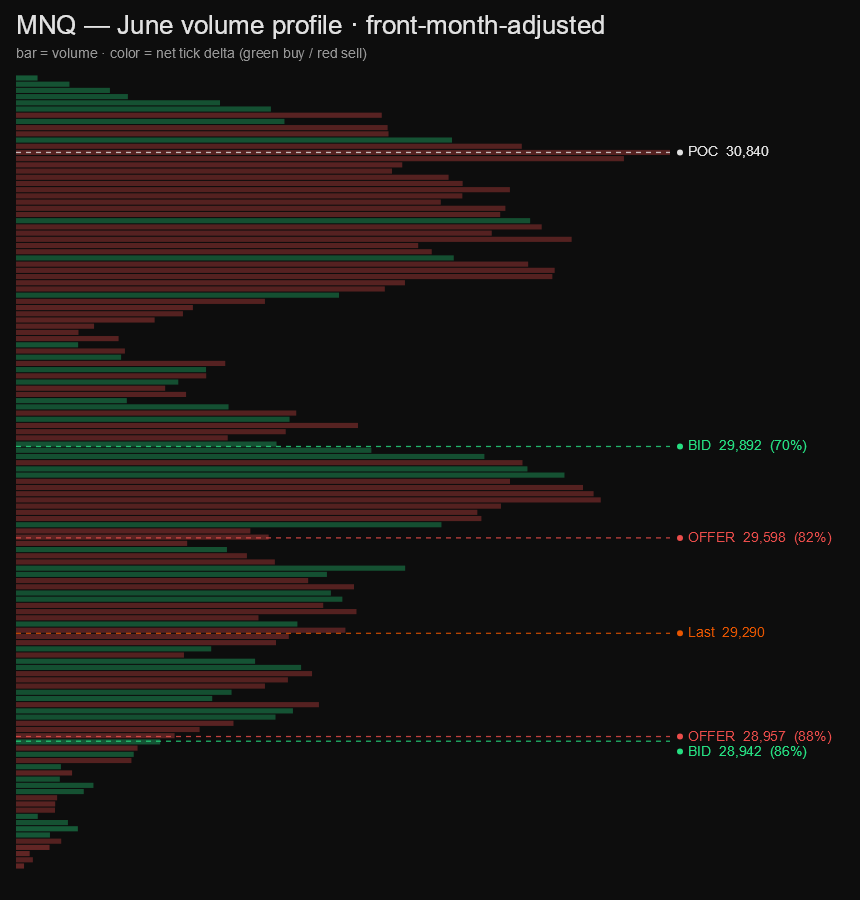
June has been a month where price traveled a wide range and delta told you not to trust most of it. MNQ's monthly range stretches from 28,511.5 to 31,092.0 — over 2,580 points — but cumulative delta on the month has run to −93,907. That's a heavy lean. To be clear about what that number means: down-moves tend to trade more aggressively than the quiet lifting that floats price higher, so a structurally negative cumulative is the baseline for any active month. But −93,907 runs well above that usual hum. The month's character is distribution, not accumulation — sellers have been leaning on the offer throughout, and the price range reflects it.
ES tells a more muted story. Monthly cumulative delta sits at −11,300 across a 400-point range (7,295.0 to 7,695.25). That's within the normal baseline — ES hasn't been screaming distribution the way MNQ has. The divergence between the two is the tell: NQ-heavy positioning unwinds faster and louder than ES when the tape turns. The first three weeks of June saw MNQ carry the selling; ES lagged. This past week, MNQ accelerated lower and ES started catching down.
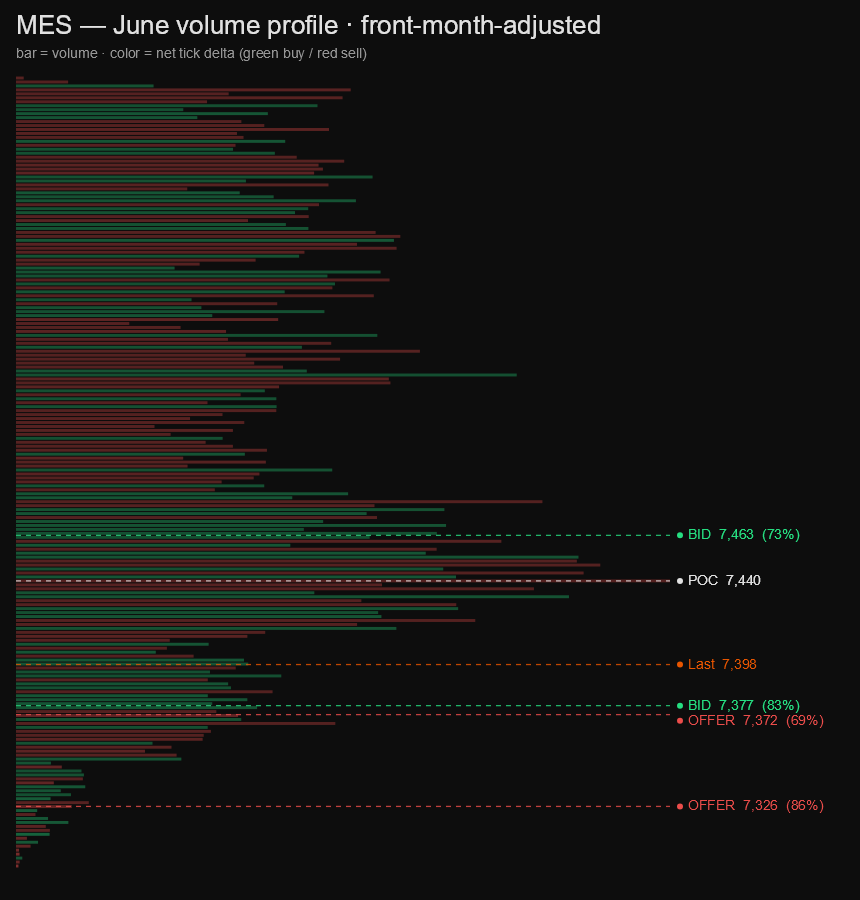
The monthly profiles show where the volume has clustered. On MNQ, the bulk of the month's trade printed well above current price — the market spent most of June higher, and the close at 29,290 sits near the lower end of the month's distribution. On ES, the close at 7,397.75 is similarly below the month's value center. Both instruments closed the week below where most of June's business got done. That's the trap the month set: price ran up into mid-June, delta never confirmed the highs, and now we're spending the last week of June giving it back.
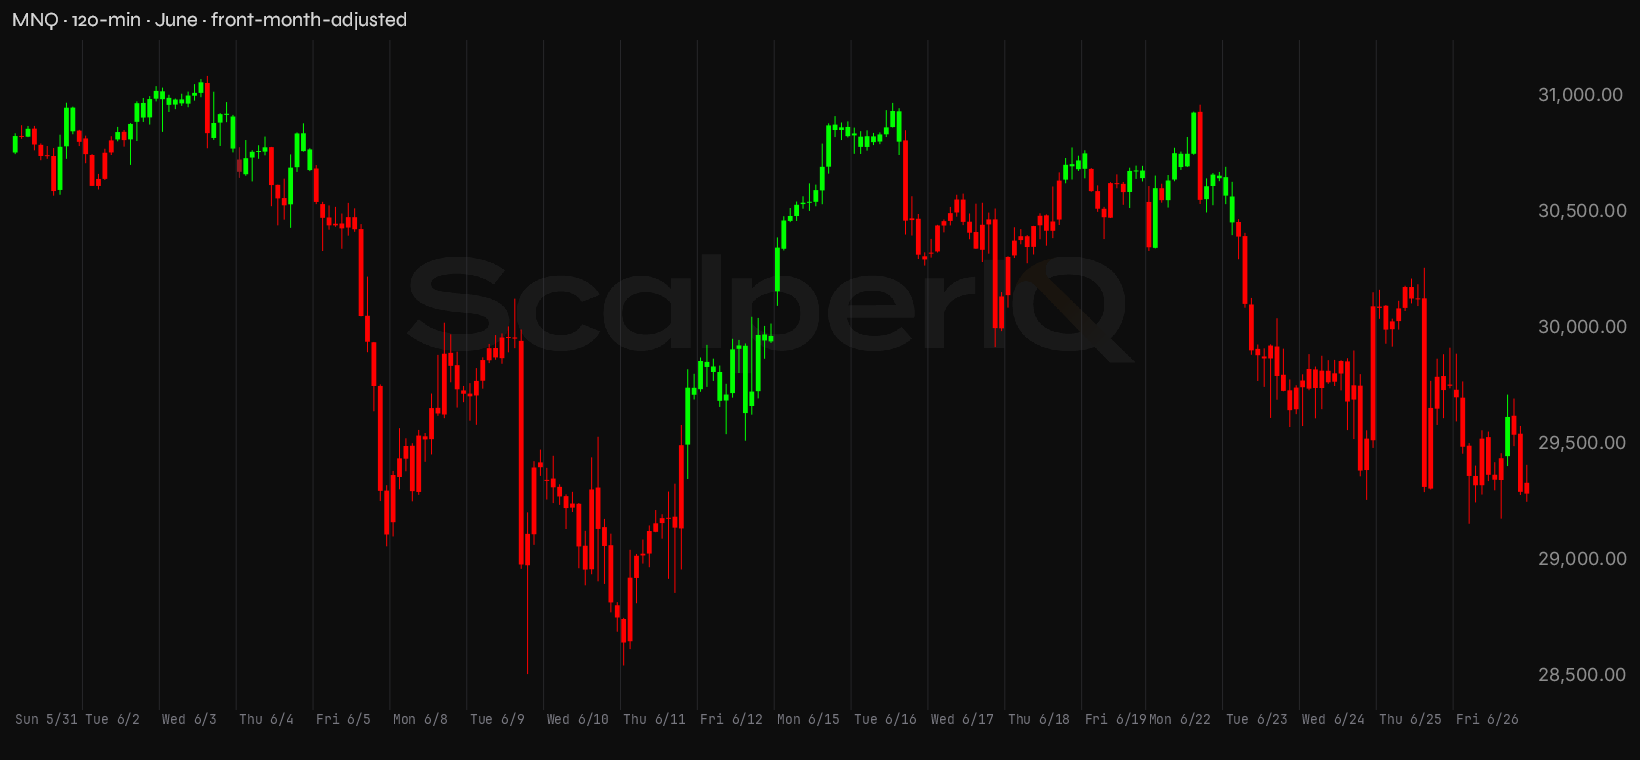
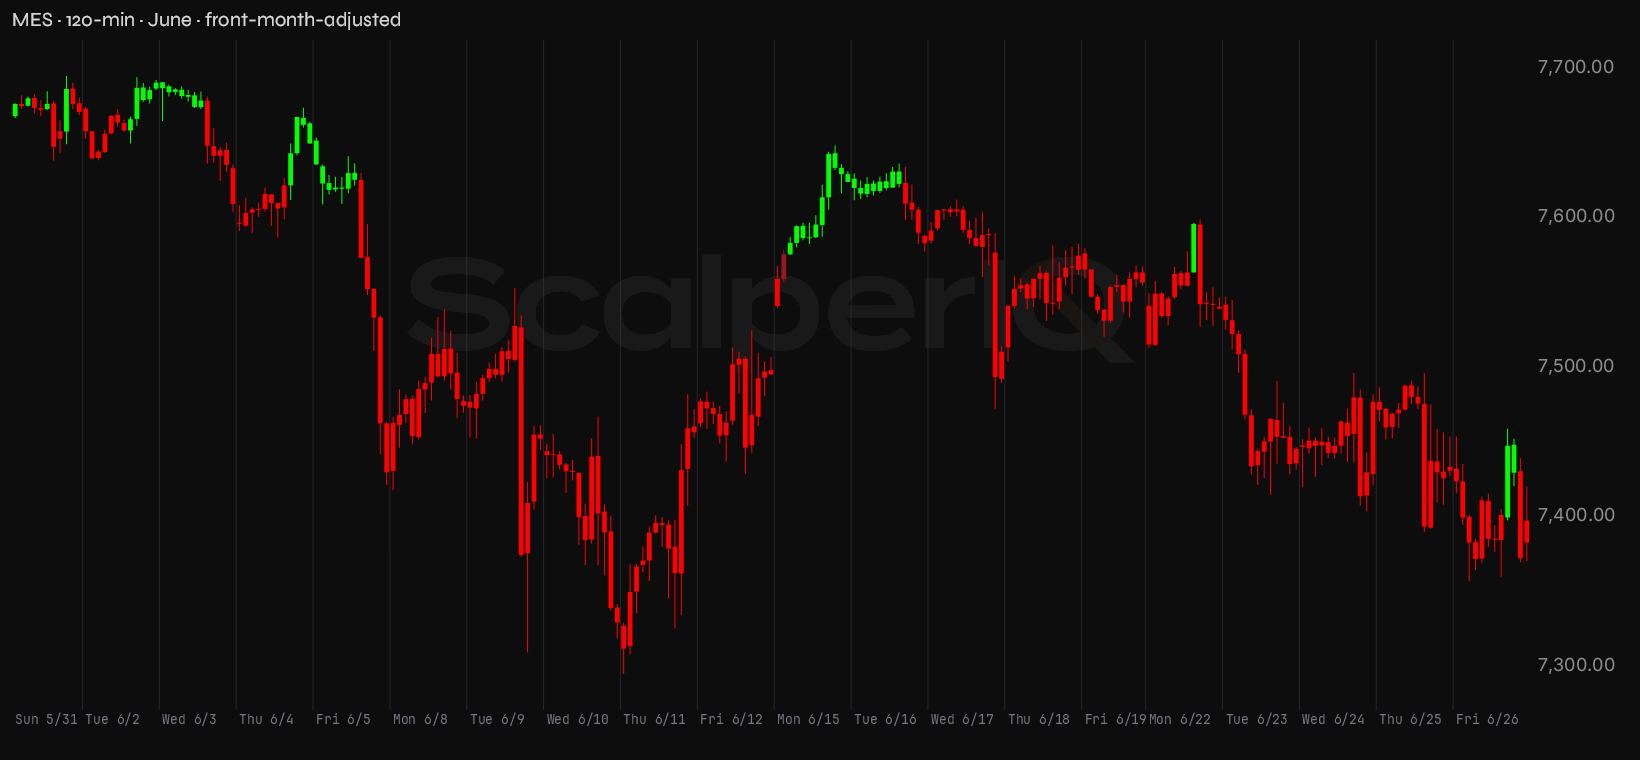
Last week, up close
Monday, June 22 opened the week near the highs. MNQ printed −7,377 delta on a 631-point range — price pushed to 30,967.75 on the session, the weekly high, but the engine was already flagging the move: sellers were leaning on the offer while price probed the top. ES posted only +3,542 delta on a much tighter 86-point range, holding near 7,540. The divergence was right there on day one: MNQ's delta was negative while price was still elevated. That's distribution into strength.
Tuesday, June 23 was where the floor gave way. MNQ dropped over 1,100 points on the session — open at 30,655.25, close at 29,747.50 — and net delta was −7,786. ES followed with −7,099 delta but a smaller price drop, closing at 7,445.75 after touching a session low of 7,415.00. The selling was real on both instruments: aggressive sellers hitting the bid, not just passive drift. MNQ led and ES confirmed.
Wednesday, June 24 was the one session that looked like a bounce. MNQ posted +937 delta — the only positive delta day of the week — on a nearly 900-point range, closing at 30,098.00. ES printed +11,440 delta, its best session of the week, closing at 7,477.25. On the surface, a recovery. But look at the delta: MNQ's +937 on a 900-point range is barely positive. ES's +11,440 is more convincing, but it came after a 130-point down day — it reads more like short covering than fresh demand. This was the session we needed to see genuine buying, and MNQ couldn't deliver it.
Thursday, June 25 erased any bounce optimism. MNQ printed −16,057 delta — the heaviest single-session selling of the week — on a 968-point range, closing at 29,760.50. That's not noise; that's sellers running the show. ES posted only +2,017 delta on the session but still closed lower at 7,433.75. MNQ's −16k day is the loudest data point of the week: whoever was buying on Wednesday was gone by Thursday, and the sellers came back with size.
Friday, June 26 closed the week out with MNQ at 29,290.00 — down another 733 points on the session, −4,115 delta. ES closed at 7,397.75, down from 7,433.75, with +3,705 delta. ES's positive delta on a down day is worth noting: some absorption at the lows, buyers stepping in as price pressed lower. But MNQ didn't share that story — it closed at the weekly low, sellers in control to the bell.
The week in one line: four of five sessions on MNQ printed negative delta, the one green delta day barely registered, and the week closed at the low. ES absorbed better but couldn't escape the gravity.
Levels I'm watching
These come from our conviction* zones — persistent order flow at specific price levels across the week, not lines drawn freehand.
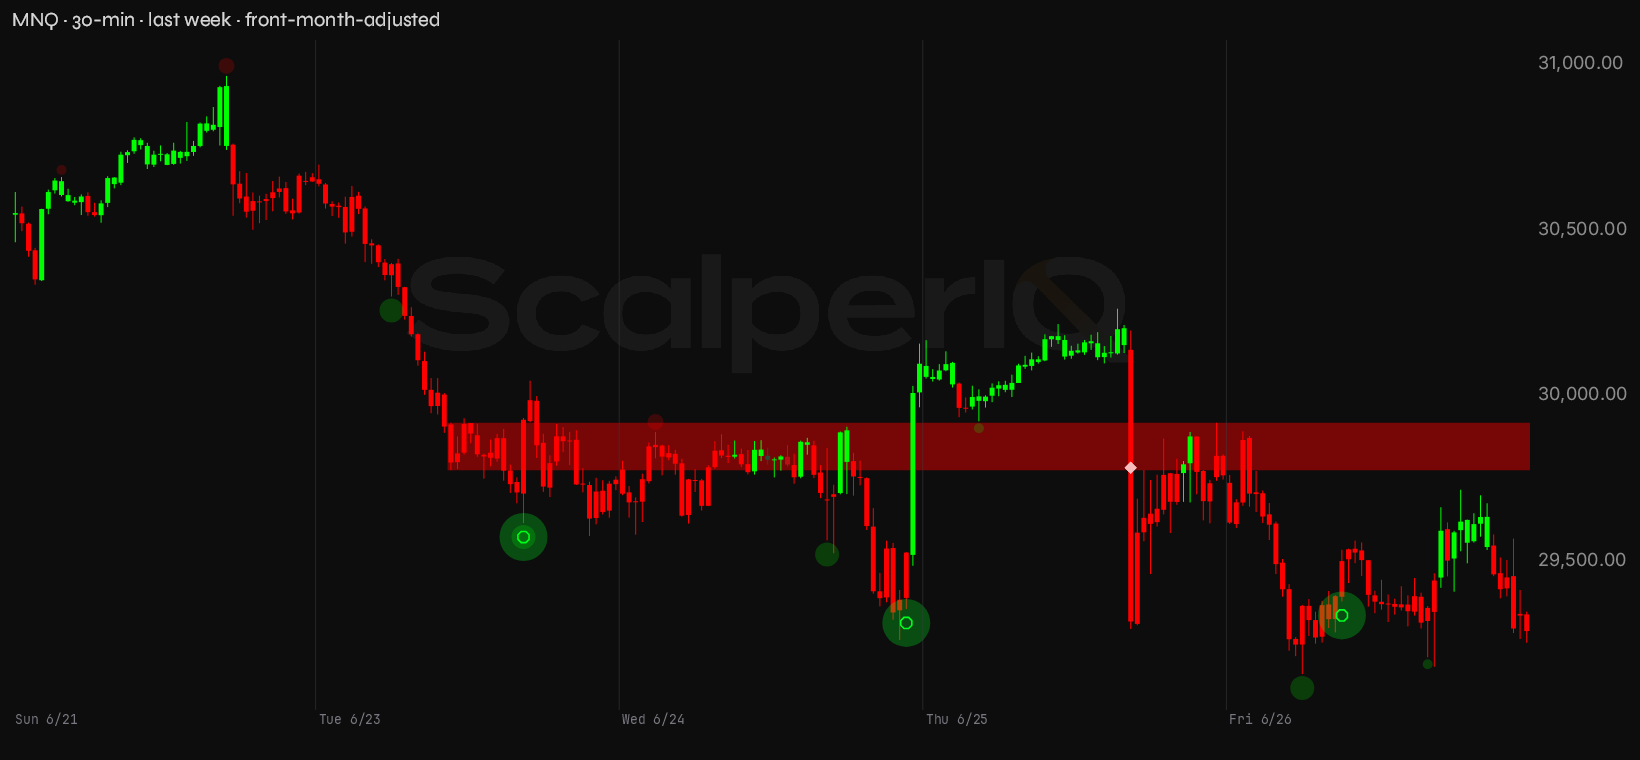
MNQ closed Friday at 29,290.00. The picture above price is crowded; below it, there's one level and then open air.
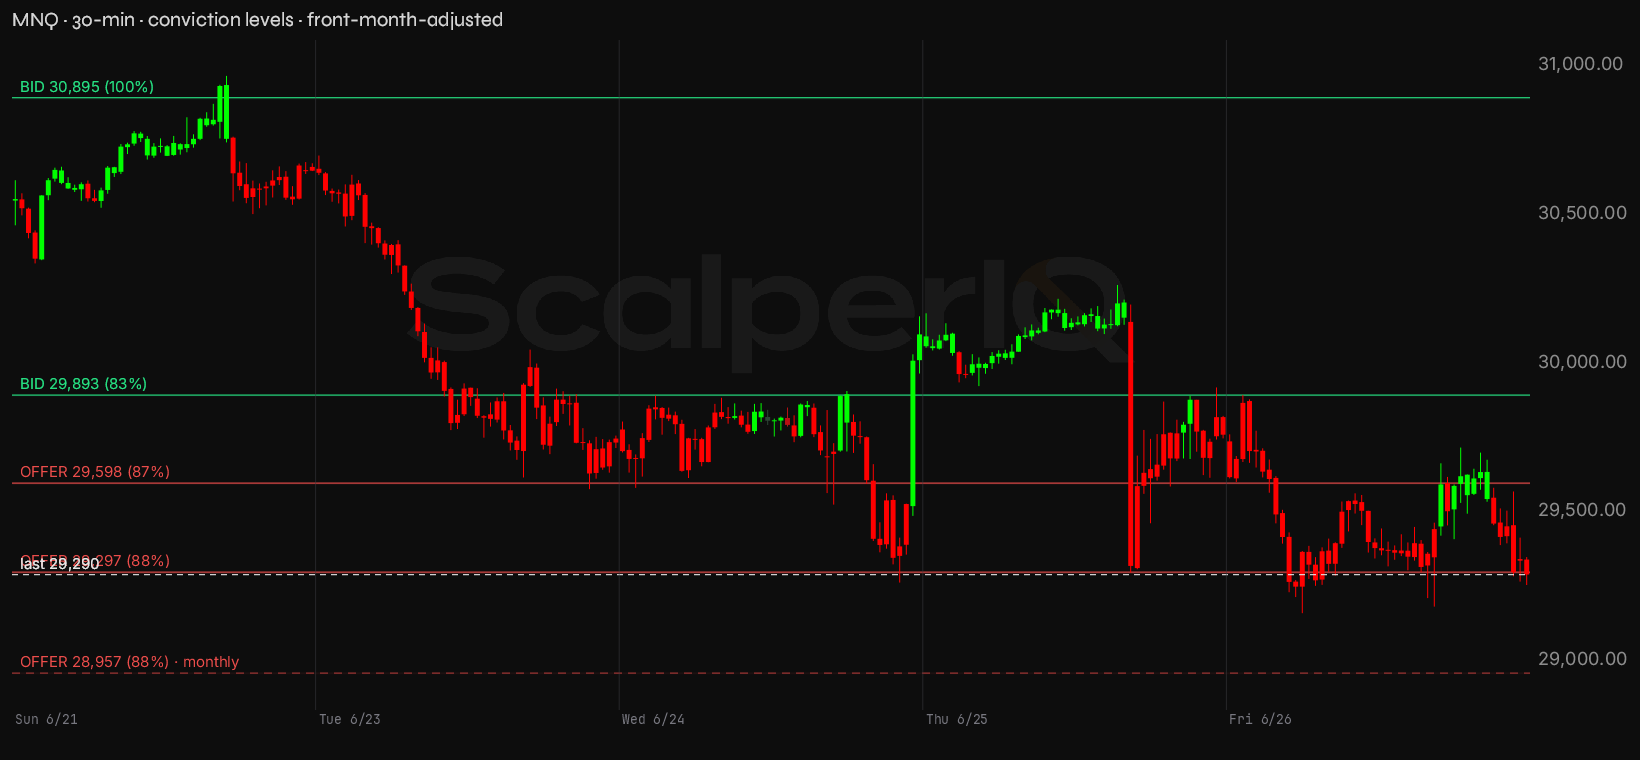
MNQ conviction zones
| Zone | Price | Read |
|---|---|---|
| Re-offer | 29,595–29,600 | Supply shelf — 87% conviction. |
| Re-offer | 29,297–29,299 | Supply shelf — 88% conviction. |
| Re-offer (monthly) | 28,955–28,961 | Supply shelf — 88% conviction. |
| Bid | 30,893–30,896 | Demand cluster — 100% conviction. |
| Bid | 29,890–29,897 | Demand cluster — 83% conviction. |
| Line in the sand | 29,160 | Last week's low — losing it is where I'd step back and reassess the bounce. |
The nearest level above price is the weekly offer shelf at 29,297 — just 7 points above the close, essentially at price. Order flow was nearly one-directional there: 88% conviction, −967 delta. That's a ceiling the tape already knows about. Above that, the next weekly offer shelf sits at 29,598 (308 points above), also 87% conviction with −3,105 delta behind it. Further up, the weekly bid shelf at 29,893 (603 points above, 83% conviction) marks where buyers showed up with +2,784 delta — that's the first real support level above current price, which tells you how far price has fallen from where buyers were active. The 100% conviction bid shelf at 30,895 is 1,605 points above the close — the high-water mark of the week's buying, now well overhead. Below the close, the monthly offer shelf at 28,957 sits 333 points lower — 88% conviction, −3,305 delta. A monthly level below price acting as an offer shelf is unusual; it means sellers were aggressive there earlier in the month, and if price reaches it, that zone becomes the next reference point. Between 29,290 and 28,957 there's open air — no weekly support on the map.
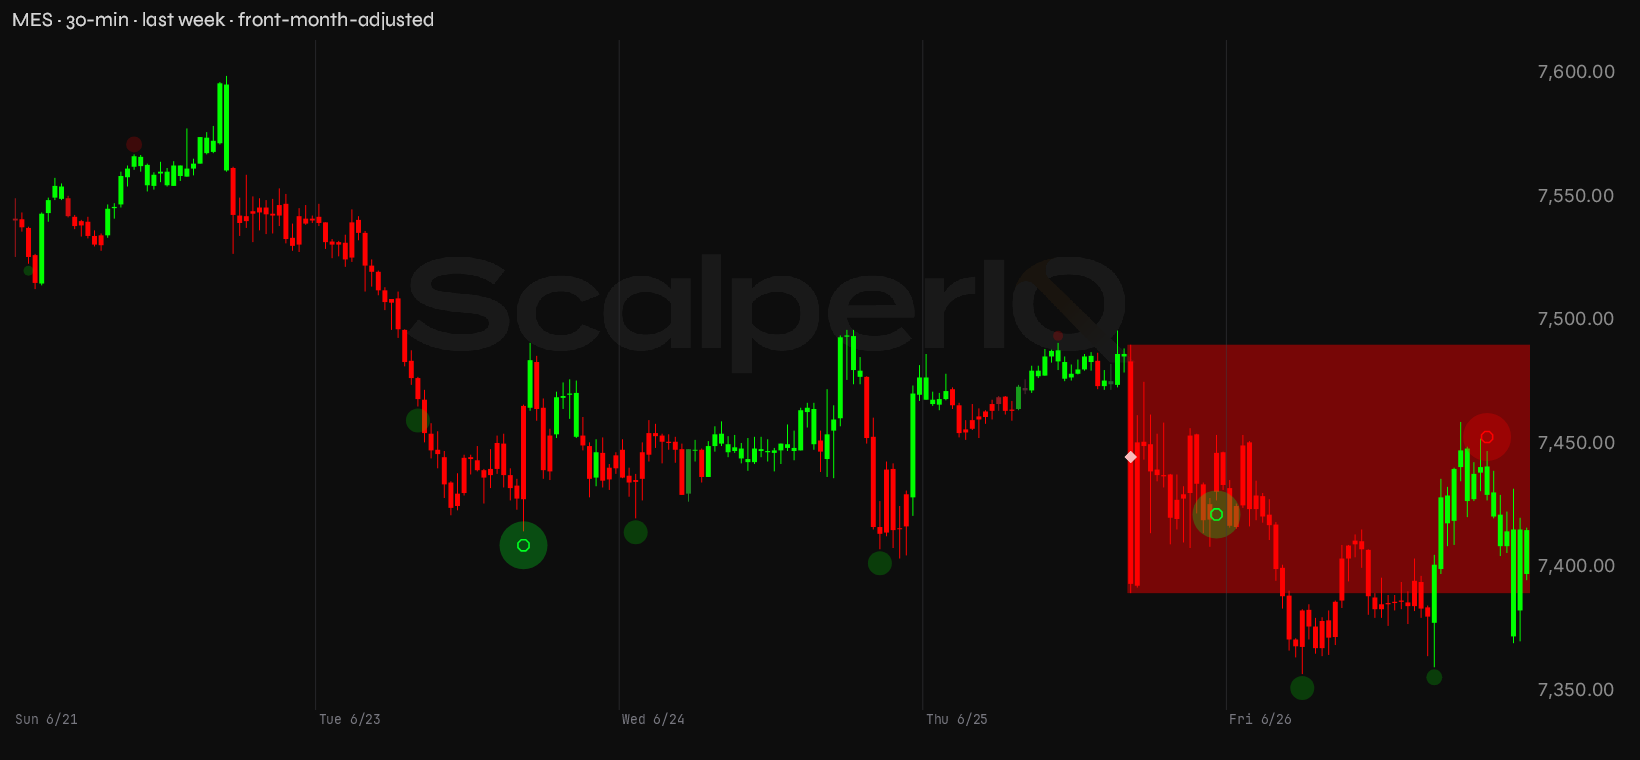
MES closed at 7,397.75. The level structure tells a similar story, with most of the map sitting above.
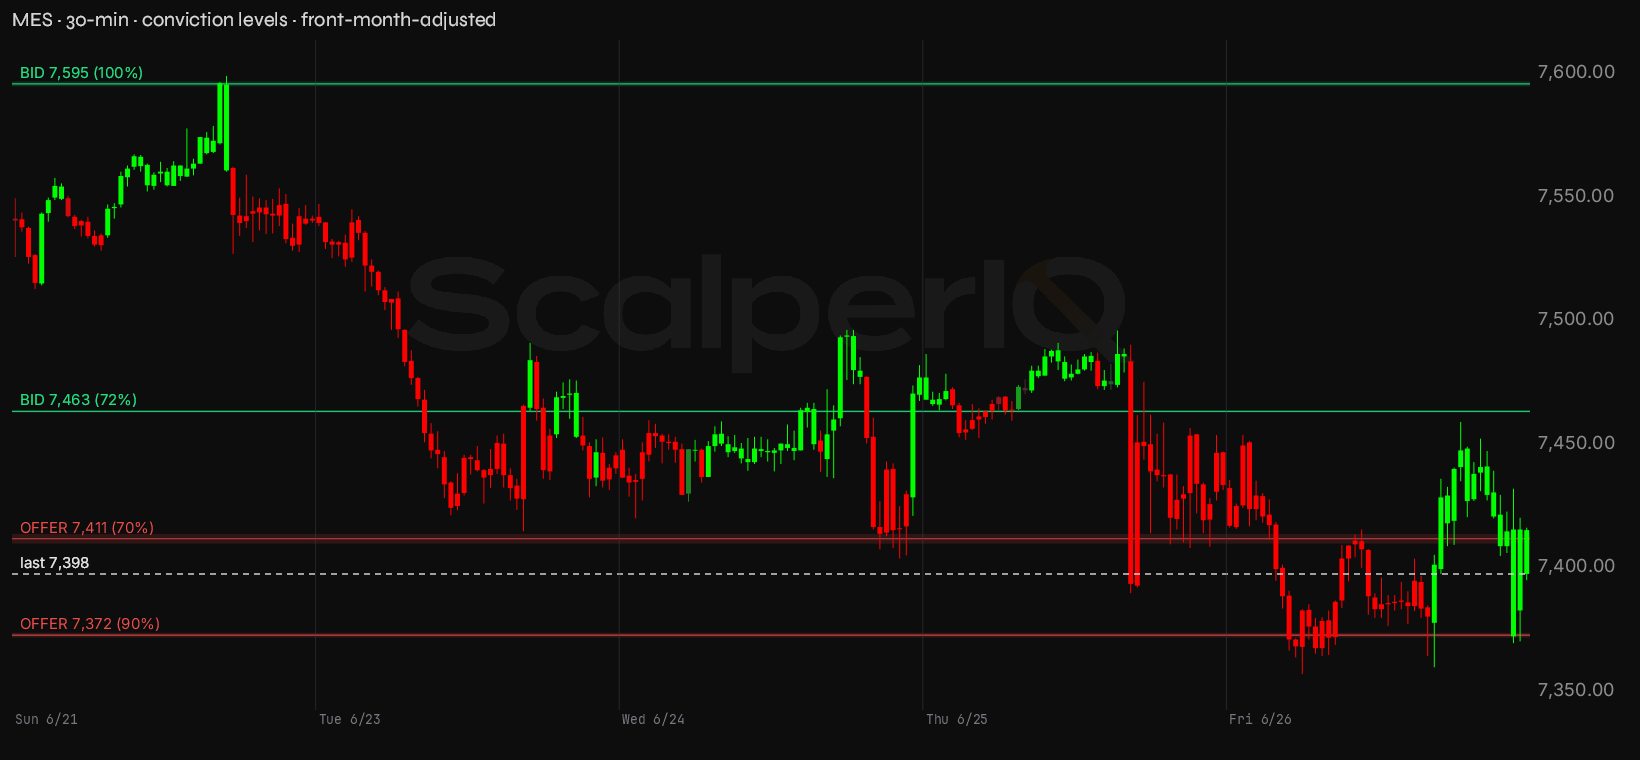
MES conviction zones
| Zone | Price | Read |
|---|---|---|
| Re-offer | 7,410–7,414 | Supply shelf — 70% conviction. |
| Re-offer | 7,372–7,374 | Supply shelf — 90% conviction. |
| Bid | 7,595–7,597 | Demand cluster — 100% conviction. |
| Bid | 7,463–7,464 | Demand cluster — 72% conviction. |
| Line in the sand | 7,357 | Last week's low — losing it is where I'd step back and reassess the bounce. |
The nearest level below price is the weekly offer shelf at 7,372 — 26 points below the close, 90% conviction, −2,879 delta. That's sellers who were active below current price this week; if price drops to test it, that's where the tape gets interesting. Just above the close, the weekly offer shelf at 7,411 sits only 14 points up (70% conviction, −1,262 delta) — another near-term ceiling. Further above, the weekly bid shelf at 7,463 (65 points up, 72% conviction) is the first level where buyers showed real presence. The 100% conviction bid shelf at 7,595–7,597 sits 198 points above the close — the week's high-conviction buying zone, now well overhead.
On MNQ, the one thing I need to see: a session where price and net delta both move higher — not short covering, not a +900 delta on a 900-point range, but genuine lifting of the offer. Until that prints, every bounce is a candidate for distribution.
On the calendar
The scheduled risk worth timing around this week:
- Thursday, July 2 — Employment Situation (June 2026), 8:30 AM ET: NFP is the largest scheduled volatility event of the month. The book goes thin into 8:30, the first spike off the number is usually noise, and the tape tends to gap wide before finding a direction. Delta imbalances in the first few minutes can be extreme and mean-reverting.
- Thursday, July 2 — Initial Jobless Claims, 8:30 AM ET: Prints simultaneously with NFP this week. On its own it's low-impact, but stacked on top of the employment number it adds to the 8:30 volatility window — one print, two reads, wider initial swings.
Both events land on the same morning, which compresses the week's risk into Thursday. The three sessions before it will have their own flow, but Thursday morning is where the tape gets loudest.
Bottom line
The bias going into the week of June 29 is cautious — MNQ's delta has been negative four of five sessions, the close sits just below a weekly offer shelf at 29,297, and the monthly cumulative delta for June reflects a month that leaned on the offer throughout. The long thesis needs a session where MNQ lifts the offer on genuine positive delta — not a short-covering pop, not a muted +937 on a wide range. If that session doesn't materialize and price instead breaks below 28,957, the monthly offer shelf below, the current range loses its footing and the next reference points are further out. ES is the tell on the other side: if ES holds its bid and delta turns positive while MNQ continues lower, the divergence widens — watch whether ES absorbs or follows.
* Conviction % — how one-sided the order flow was at that price. 100% means it traded essentially one direction; 50% means buyers and sellers fought it to a draw. It's a read on agreement, not size — a decisive level can still be a thin one.
* Delta means raw tick delta — executed buy volume minus sell volume, straight off the tape.
* MNQ / MES are the Micro E-mini Nasdaq-100 and S&P 500 futures — same index price action as the full-size NQ / ES, at a smaller contract size. We read the micros because they're where most retail order flow lives; the delta and volume figures here are micro-contract counts.
Delta Reads are my own read of the order flow — informational only, not financial advice and not a recommendation to buy or sell anything. Trading futures is not suitable for all persons: it carries a substantial risk of loss, and you can lose more than your initial investment. This is my interpretation of the data and it can contain errors — in the data, in the analysis, or both. Do your own due diligence and trade your own plan.
Get the Delta Reads
Our weekly order-flow read on MES and MNQ — what the tape did, and the levels we're watching next. One email a week. No noise.
See what ScalperIQ looks like on a live chart.
Try Free for 14 DaysNo credit card required. Available on MotiveWave, EdgeProX, and NinjaTrader.