
Delta Read · Week of June 15, 2026 — Four Red Sessions and a Holiday Close — MNQ Keeps Selling Into Its Own Rally
Get the Delta Reads
Our weekly order-flow read on MES and MNQ — what the tape did, and the levels we're watching next. One email a week. No noise.
Last week the delta picture on MNQ flipped hard from the prior read. The week of June 8 closed with MNQ printing +6,209 net delta — barely positive, built mostly on one session — and ES running a similar neutral lean at −7,929. This week the roll had already gone through (more on that below), so price levels don't carry over cleanly, but the delta direction absolutely does: MNQ swung to −22,864 on the week, a sharp reversal of that positive lean. ES stayed negative at −7,620, roughly in line with last week but with a different internal story. The direction flipped; the selling pressure got louder.
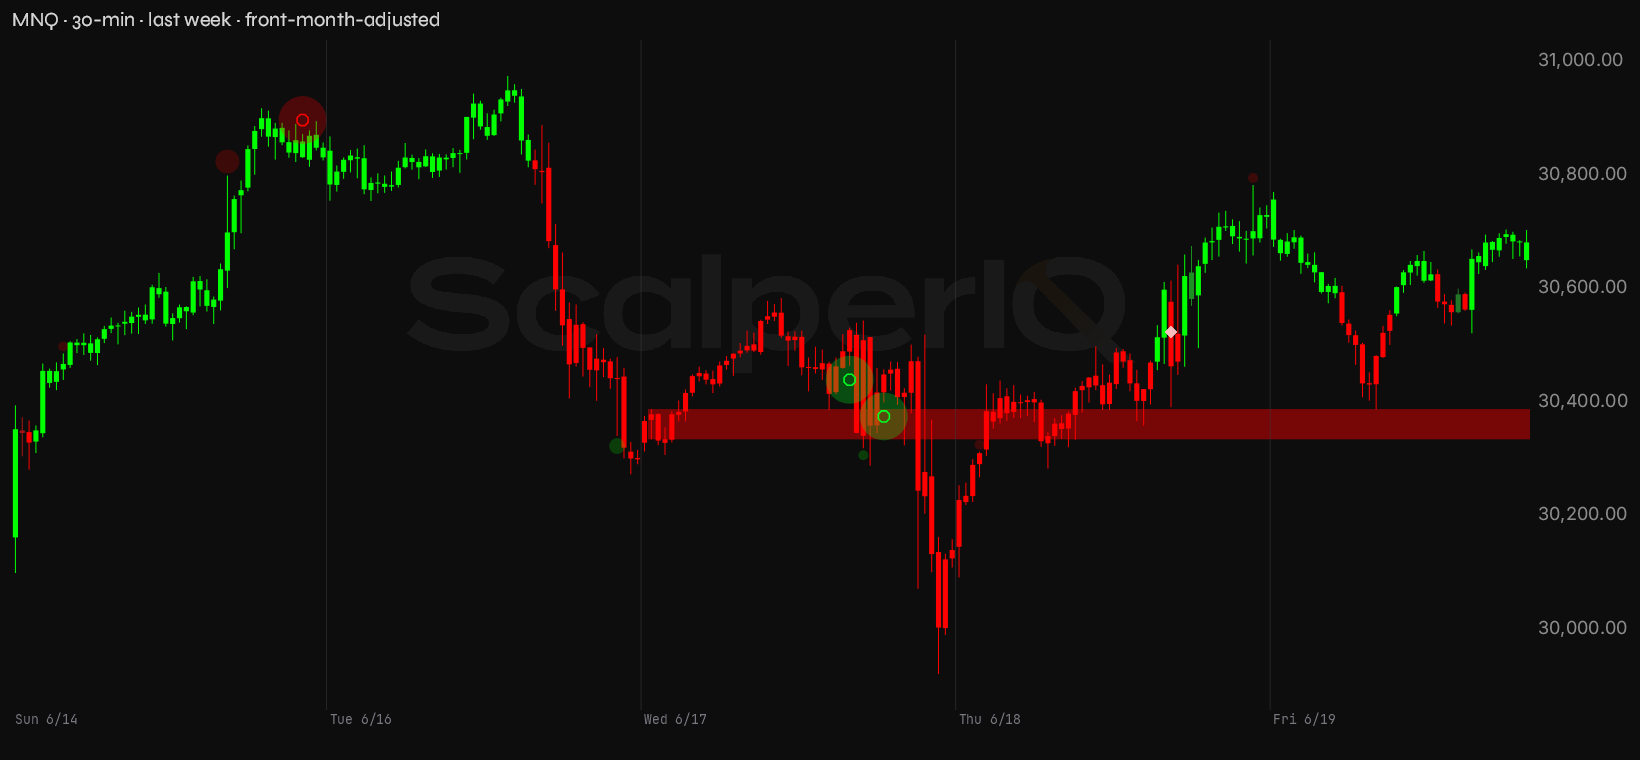
Here's the full week on MNQ through the ScalperIQ engine:
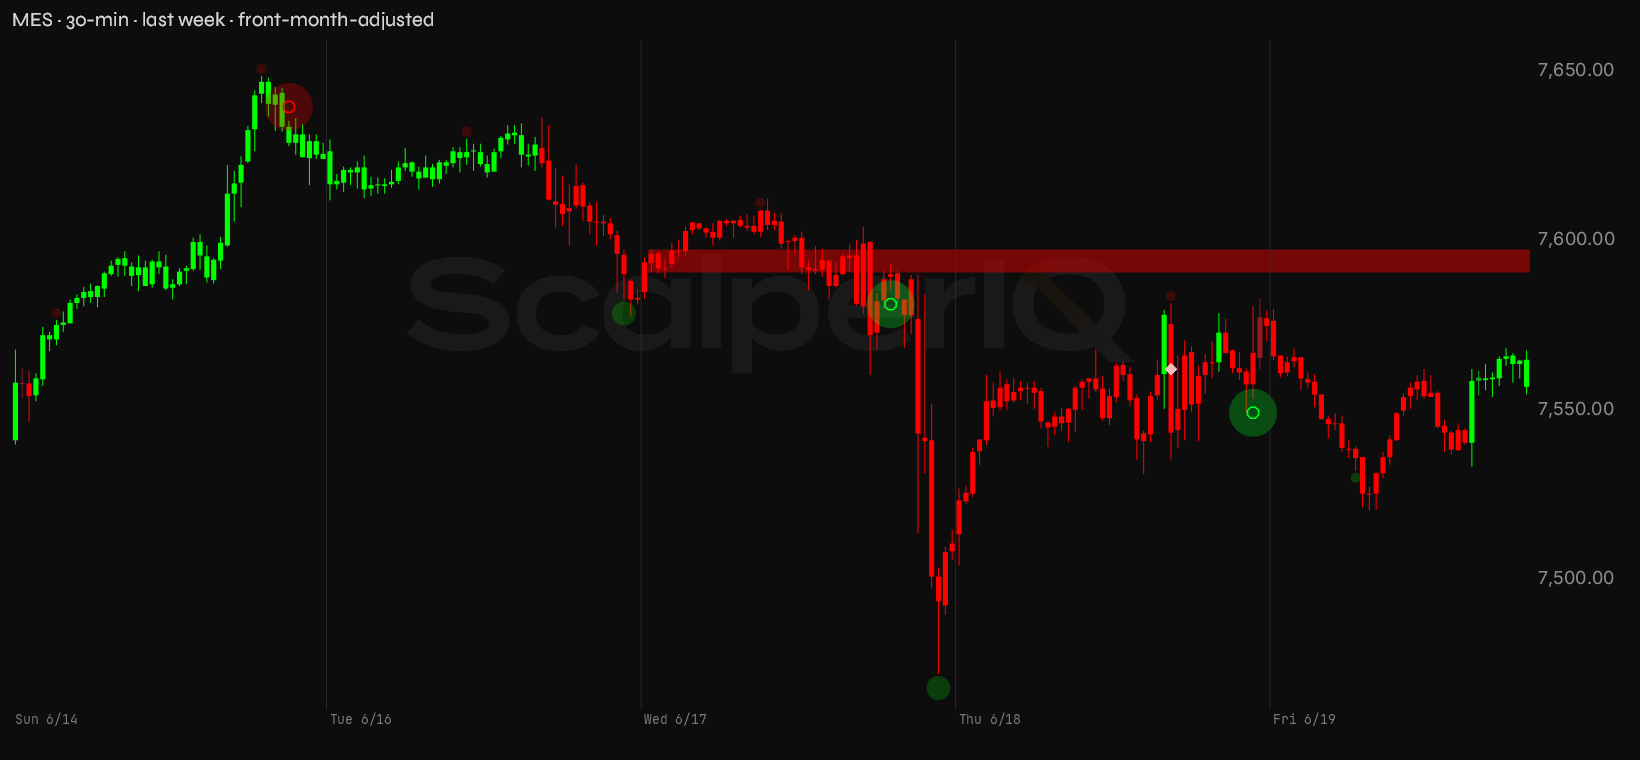
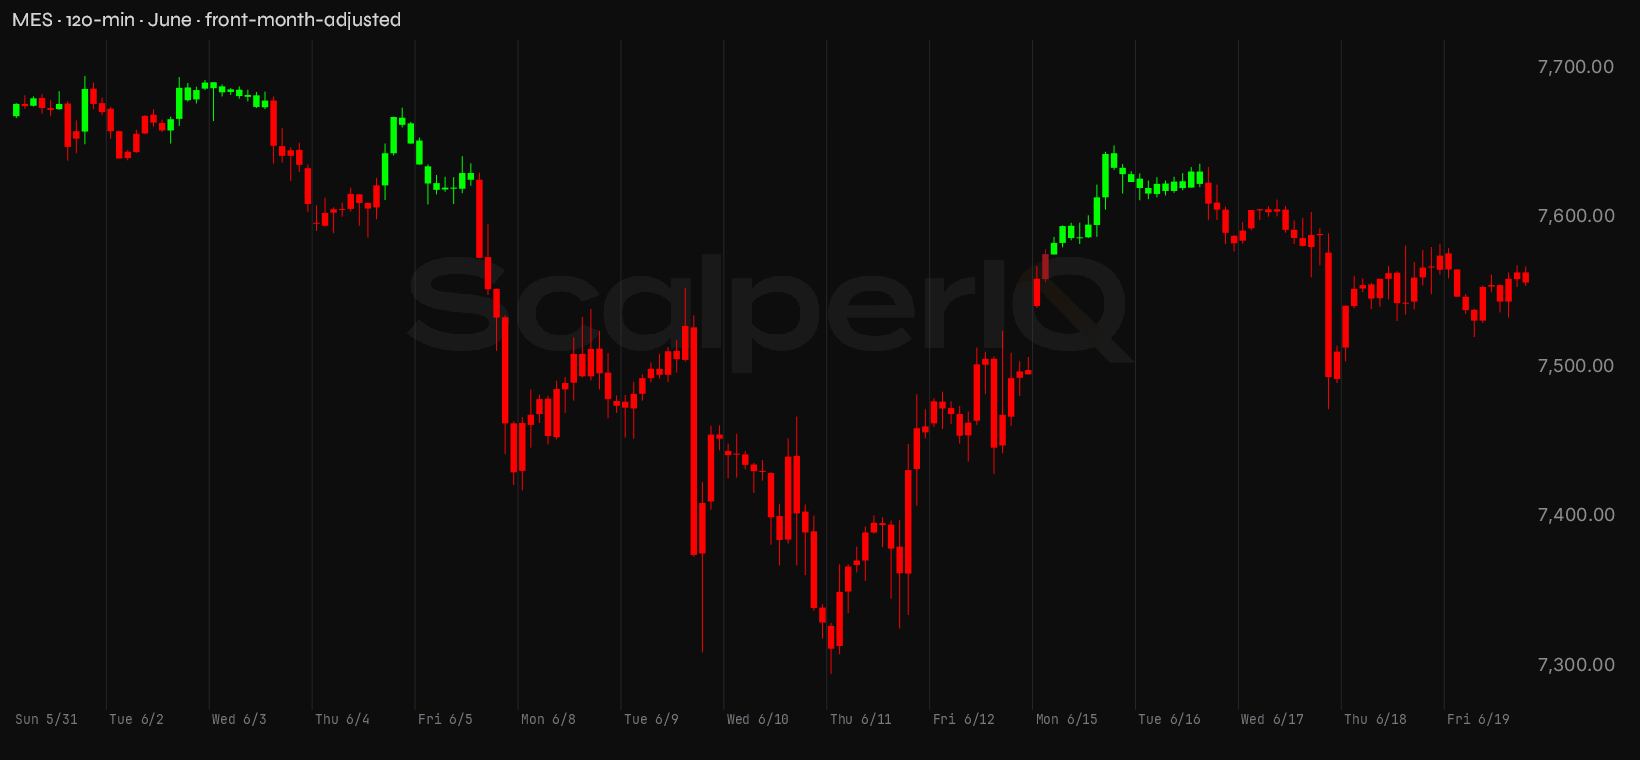
And MES alongside it:
Quick version: both instruments closed Friday neutral-to-weak on the week's delta, price sits below Monday's open on MNQ, and the one thing that matters most is whether the tape can produce a session where price and delta rise together — because it hasn't managed that once this week.
The month set the trap
June has been doing something worth paying attention to. Price has made a serious run — MNQ's monthly range is 2,580.5 points (28,511.50 low to 31,092.00 high), and MES has covered 400.25 points on the month. That's not a quiet grind. But underneath it, cumulative delta has stayed red the entire time. MNQ is sitting at −59,509 on the month. MES is at −39,103.
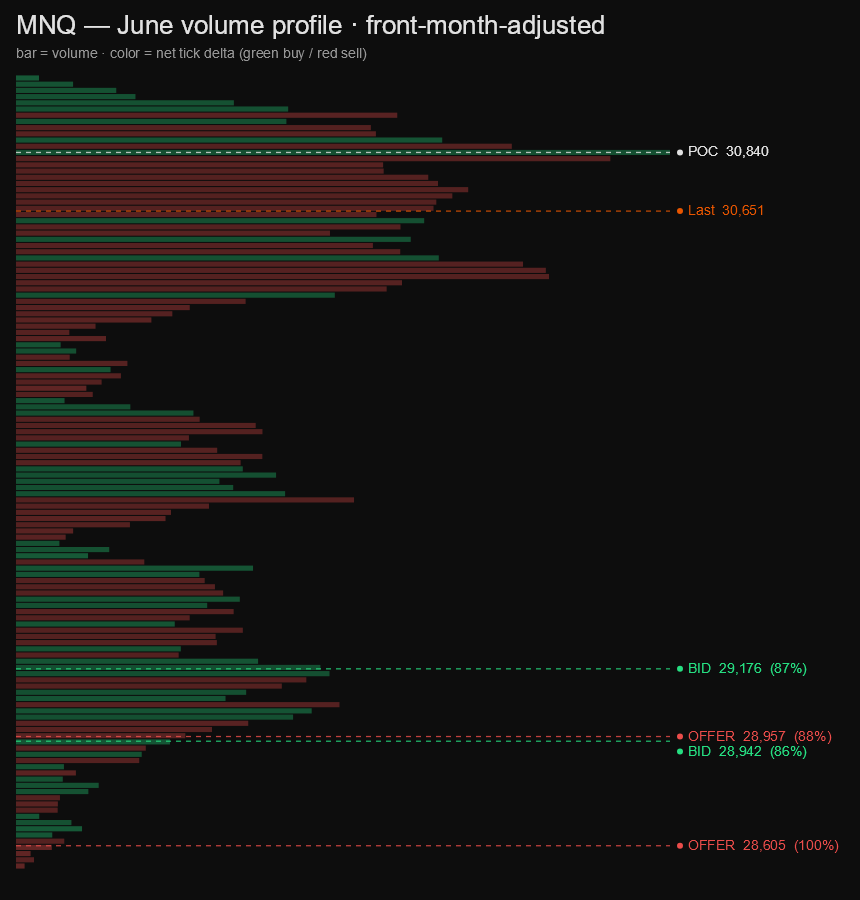
Now, a note on what that number actually means: cumulative delta runs structurally negative in most rising markets because panic selling and stop-running trade with far more aggression than the quiet, passive lifting that floats price higher. A big chunk of that −59,509 is that baseline hum. But even accounting for that, June's lean is running heavier than usual for a month where price has been pushing higher. This isn't just the normal negative drift — there's a real bid/offer imbalance buried in here.
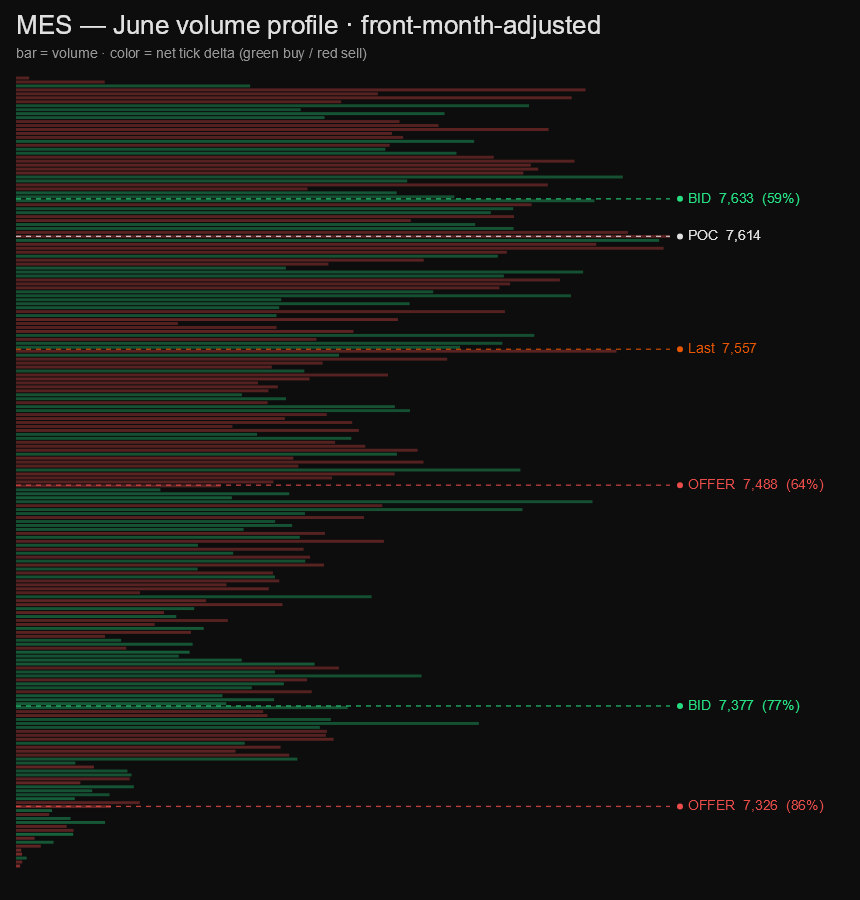
MES tells the same story. The month's cumulative delta has been red while price climbed from the 7,295 low toward the 7,695 high. That kind of divergence — price up, delta persistently leaning on the bid — is exactly what our engine is built to surface. It doesn't mean the rally is fake, but it does mean the buying that's been moving price hasn't been aggressive. Somebody's been lifting offers quietly while sellers hit bids more urgently. That's a market that can move fast in either direction when the passive buyer steps back.
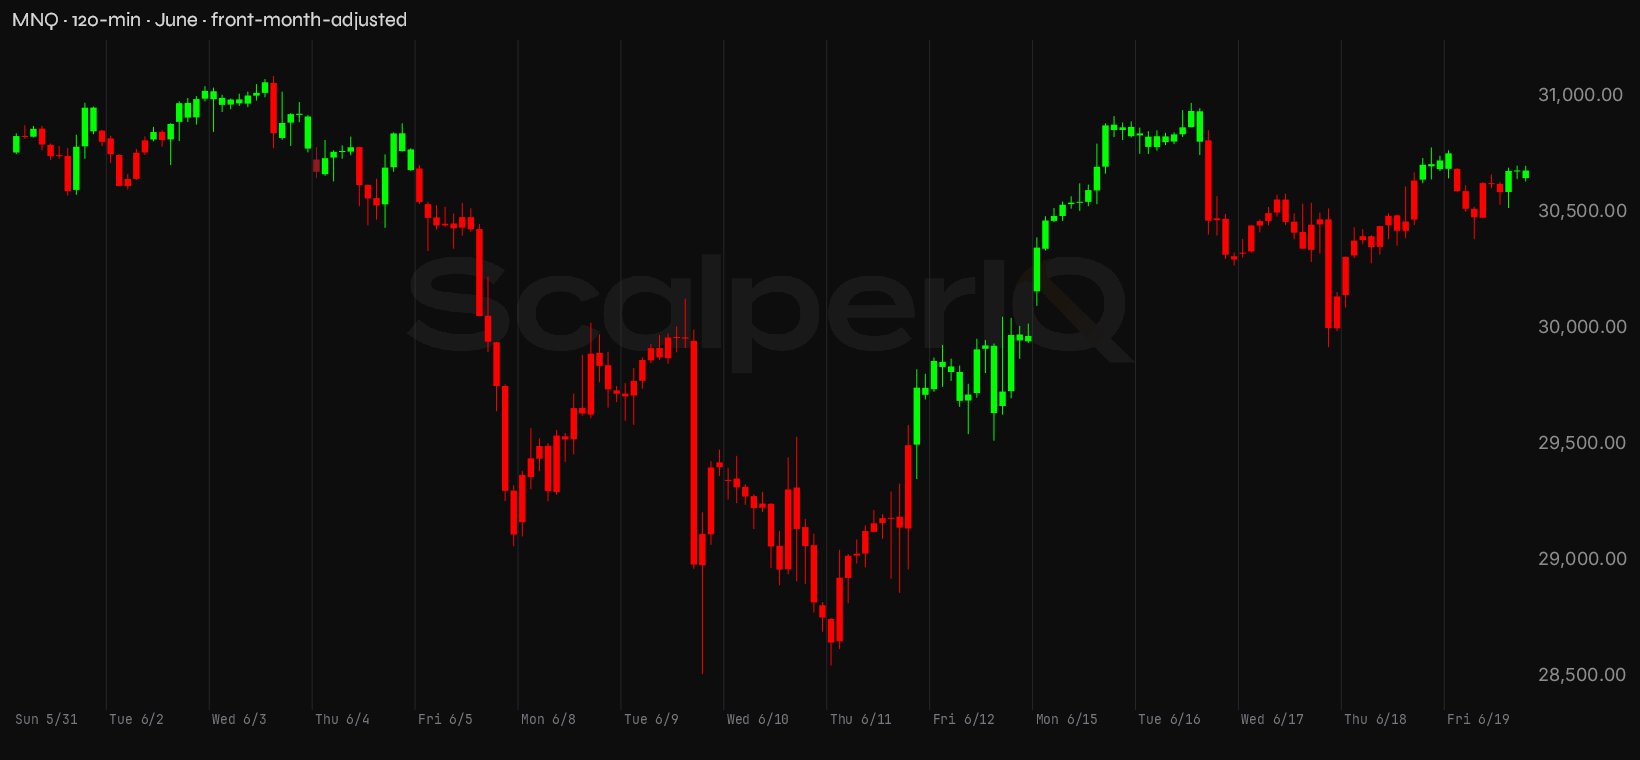
The monthly profile shows the bulk of volume concentrated mid-range on both instruments — neither instrument has built meaningful acceptance at the highs. That's the trap the month set: a wide range, a high that got touched and rejected, and cumulative delta that never confirmed the push.
Last week, up close
Monday, June 15 was the one session that looked like a real bid. MNQ opened at 30,162.75, ran 818.5 points, and closed at 30,832.00 with net delta of +285. That's barely positive for a session that covered nearly 820 points — the engine colored it green but the delta underneath was thin. MES told an even more skeptical story: +391 net delta on a 108.75-point range that reached 7,648.75 at the high. Price got to the top of the weekly range on Monday, and the buying conviction behind it was minimal. That's a setup, not a launch.
Tuesday, June 16 was where MNQ showed its hand. Price opened at 30,843.75, tagged 30,975.50 — the week's high — and then sold off 701.75 points to close at 30,300.25. Net delta: −11,893. That's the real session of the week. Sellers were leaning hard on the bid from the open, and the new high was a phantom — price pushed above Monday's close but the delta didn't follow. MES had the opposite internal story on Tuesday: +3,432 net delta but price still closed lower at 7,583.25. MES buyers were lifting the offer while MNQ sellers were running the show. That divergence between the two instruments on the same session is worth filing away.
Wednesday, June 17 extended the selling. MNQ dropped another 662.25 points (30,329.50 open to 30,140.50 close) on −5,920 delta, tagging the week's low at 29,922.00. MES followed: −2,440 delta, 140.25-point range, closing at 7,510.75 after tagging 7,472.25 at the low. Two consecutive sessions of sellers leaning on the bid, with MNQ accumulating nearly −18,000 delta across Tuesday and Wednesday combined.
Thursday, June 18 was the confusing one. MNQ recovered 691 points (30,146.25 to 30,727.25 close) — but net delta was −977. Price up nearly 700 points on negative delta. MES did the same: closed at 7,575.00, up from 7,513.50, on −8,153 delta — the single largest negative-delta session of the week for ES. A rally built on sellers stepping back isn't the same as a rally built on buyers stepping in. Short covering, not fresh demand. That's a fragile foundation.
Friday, June 19 was Juneteenth — CME equity-index futures closed early at 12:00 PM CT. The session's muted range and thin delta after late morning is the holiday close, not an order-flow signal. MNQ printed −4,359 delta on a 383-point range, closing at 30,651.00. MES came in at −850 delta, closing at 7,557.00. Neither number means much given the truncated session — read the close, not the delta.
Levels I'm watching
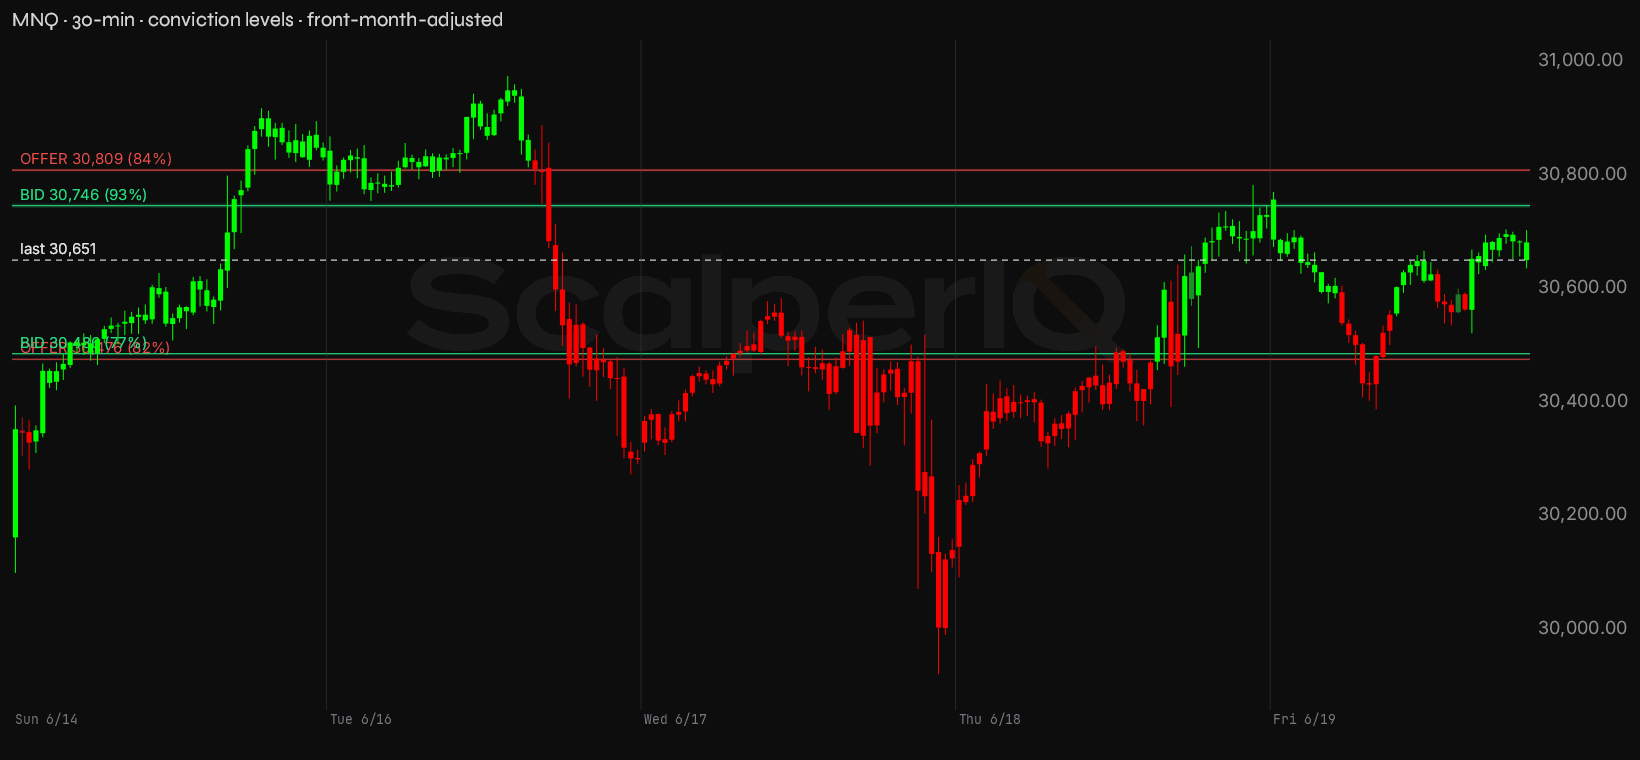
These come from our conviction* zones — order flow clusters that built across the week's sessions at specific price levels, not lines drawn on a chart by hand.
Starting with MNQ. The close Friday was 30,651.00. Here's what the engine found:
MNQ conviction zones
| Zone | Price | Read |
|---|---|---|
| Re-offer | 30,807–30,812 | Supply shelf — 84% conviction. |
| Re-offer | 30,475–30,478 | Supply shelf — 82% conviction. |
| Bid | 30,743–30,751 | Demand cluster — 93% conviction. |
| Bid | 30,486–30,487 | Demand cluster — 77% conviction. |
| Line in the sand | 29,922 | Last week's low — losing it is where I'd step back and reassess the bounce. |
The two levels above price are the ones that matter most heading into next week. The weekly offer shelf at 30,808.68 (158 points above the close) carries 84% conviction — order flow was nearly one-directional there, sellers leaning on the offer. Just below it, the 30,745.70 bid shelf (95 points above) carries 93% conviction — that's the highest conviction level in the MNQ set, and it's sitting right in the path of any bounce attempt. Price needs to clear both of those to have any room to breathe. Below the close, both the 30,475.81 offer shelf (175 points below, 82% conviction) and the 30,486.00 bid shelf (165 points below, 77% conviction) are clustered tightly together — that's a contested zone where buyers and sellers both left prints, and it's the first real structure if price fades from here.
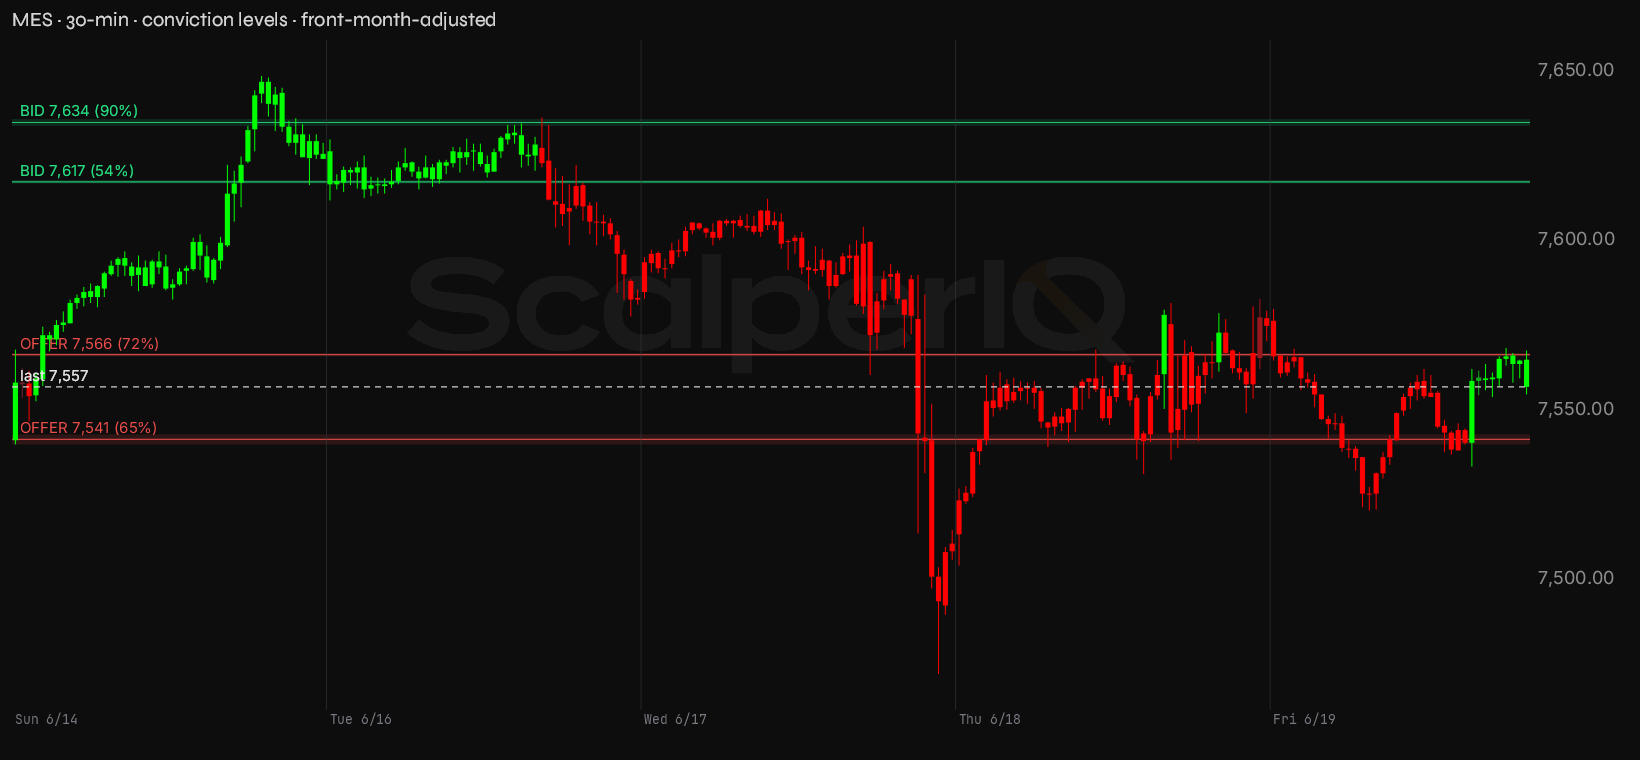
Now MES. The close was 7,557.00.
MES conviction zones
| Zone | Price | Read |
|---|---|---|
| Re-offer | 7,566–7,567 | Supply shelf — 72% conviction. |
| Re-offer | 7,540–7,543 | Supply shelf — 65% conviction. |
| Bid | 7,634–7,636 | Demand cluster — 90% conviction. |
| Bid | 7,617–7,618 | Demand cluster — 54% conviction. |
| Line in the sand | 7,472 | Last week's low — losing it is where I'd step back and reassess the bounce. |
MES is sitting in a tighter spot. The 7,566.00 offer shelf (9 points above the close, 72% conviction) is right on top of price — that's essentially at the close. Any early strength next week runs immediately into that level. Above it, the 7,617.00 bid shelf (60 points above, 54% conviction) is the lower-conviction level of the bunch — order flow was more mixed there. The 7,634.01 bid shelf (77 points above, 90% conviction) is the one I'd watch if price gets above 7,617: 90% conviction means order flow was almost entirely one-directional at that price. Below the close, the 7,541.19 offer shelf (16 points below, 65% conviction) is the first structure on the downside — sellers left prints there too, so a dip back into that zone is contested, not clean support.
The one thing I need to see: a session where MNQ price and net delta rise together. We haven't had one since Monday's barely-positive read, and even that was thin. Until that happens, every bounce is a candidate for the same Thursday pattern — price up, delta down, short covering masquerading as demand.
Housekeeping: the data's roll-adjusted
The data rolled NQM6 → NQU6 on Thursday, June 12. The roll carried a +284.25-point contango premium, and it's been back-adjusted out across the entire window. Any price references in this read should be read on the NQU6 contract — chart prices differ from the raw front-month print by that premium, so don't use these levels for stop placement without checking the current contract price. Nothing to manage now; the next roll isn't until September 14.
On the calendar
The scheduled risk worth timing around next week:
- Thursday, June 25 — GDP (Third Estimate, Q1 2026), 8:30 AM ET. The third estimate rarely moves markets the way the advance does, but the tape still thins into the print and the first spike off the number is mostly noise — what matters is which way delta leans once the dust settles.
- Thursday, June 25 — Initial Jobless Claims, 8:30 AM ET. Drops at the same time as GDP. Low-impact most weeks, but a surprise reading stacked on top of the GDP print can extend the volatility window past the usual first-five-minutes flush.
Both events hit the tape simultaneously Thursday morning — that 8:30 window will be compressed and jumpy. The rest of the week looks relatively clean from a scheduled-risk standpoint.
Bottom line
The bias into the week of June 22 is neutral with a downward lean — four of five sessions closed on negative delta, the month's cumulative flow has been hitting the bid harder than a normal rising month would suggest, and every bounce this week was built on sellers stepping back rather than buyers stepping up. MNQ leads if the thesis plays out: watch whether it can reclaim the 30,745.70 bid shelf on positive delta, because that 93% conviction level sitting 95 points above the close is the first real test of whether buyers are willing to pay up. MES is the tell on the downside — if the 7,566.00 offer shelf (9 points above the close) caps every early rally attempt and price starts making lower daily lows, the short-covering bounce from Thursday is already done. The read holds while MNQ stays below 30,808 and delta stays red on up days; a session with price and delta both rising would be the first reason to reassess the lean.
* Conviction % — how one-sided the order flow was at that price. 100% means it traded essentially one direction; 50% means buyers and sellers fought it to a draw. It's a read on agreement, not size — a decisive level can still be a thin one.
* Delta means raw tick delta — executed buy volume minus sell volume, straight off the tape.
* MNQ / MES are the Micro E-mini Nasdaq-100 and S&P 500 futures — same index price action as the full-size NQ / ES, at a smaller contract size. We read the micros because they're where most retail order flow lives; the delta and volume figures here are micro-contract counts.
Delta Reads are my own read of the order flow — informational only, not financial advice and not a recommendation to buy or sell anything. Trading futures is not suitable for all persons: it carries a substantial risk of loss, and you can lose more than your initial investment. This is my interpretation of the data and it can contain errors — in the data, in the analysis, or both. Do your own due diligence and trade your own plan.
Get the Delta Reads
Our weekly order-flow read on MES and MNQ — what the tape did, and the levels we're watching next. One email a week. No noise.
See what ScalperIQ looks like on a live chart.
Try Free for 14 DaysNo credit card required. Available on MotiveWave, EdgeProX, and NinjaTrader.