
Delta Read · Week of June 8, 2026 — Negative Delta, Rising Price — June Is Lying to Someone
Get the Delta Reads
Our weekly order-flow read on MES and MNQ — what the tape did, and the levels we're watching next. One email a week. No noise.
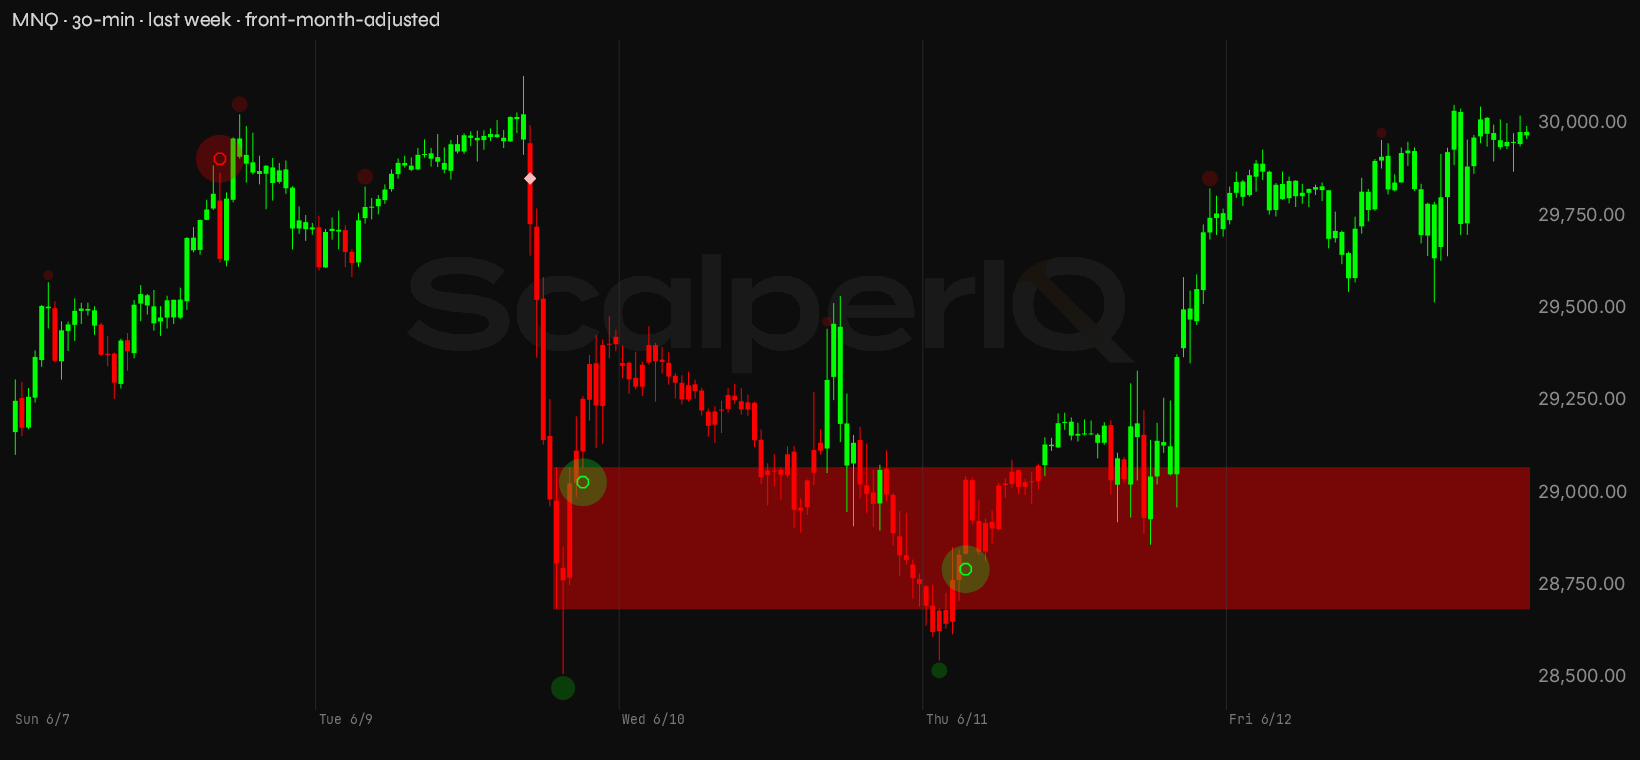
The week of June 8 opened with a tape that looked like it was trying to forget what happened on Tuesday and Wednesday. MNQ printed a 1,619-point range on June 9 alone — the widest session of the week — then bled another 841 points on June 10, tagging 28,511.50 before Thursday's reversal. Pull the 30-minute view through the ScalperIQ engine and the picture is a market that sold hard, absorbed at the lows, and clawed back to near-week highs by Friday's close. Net weekly delta for MNQ came in at +6,209 — positive, but barely, and almost entirely on the back of one session.
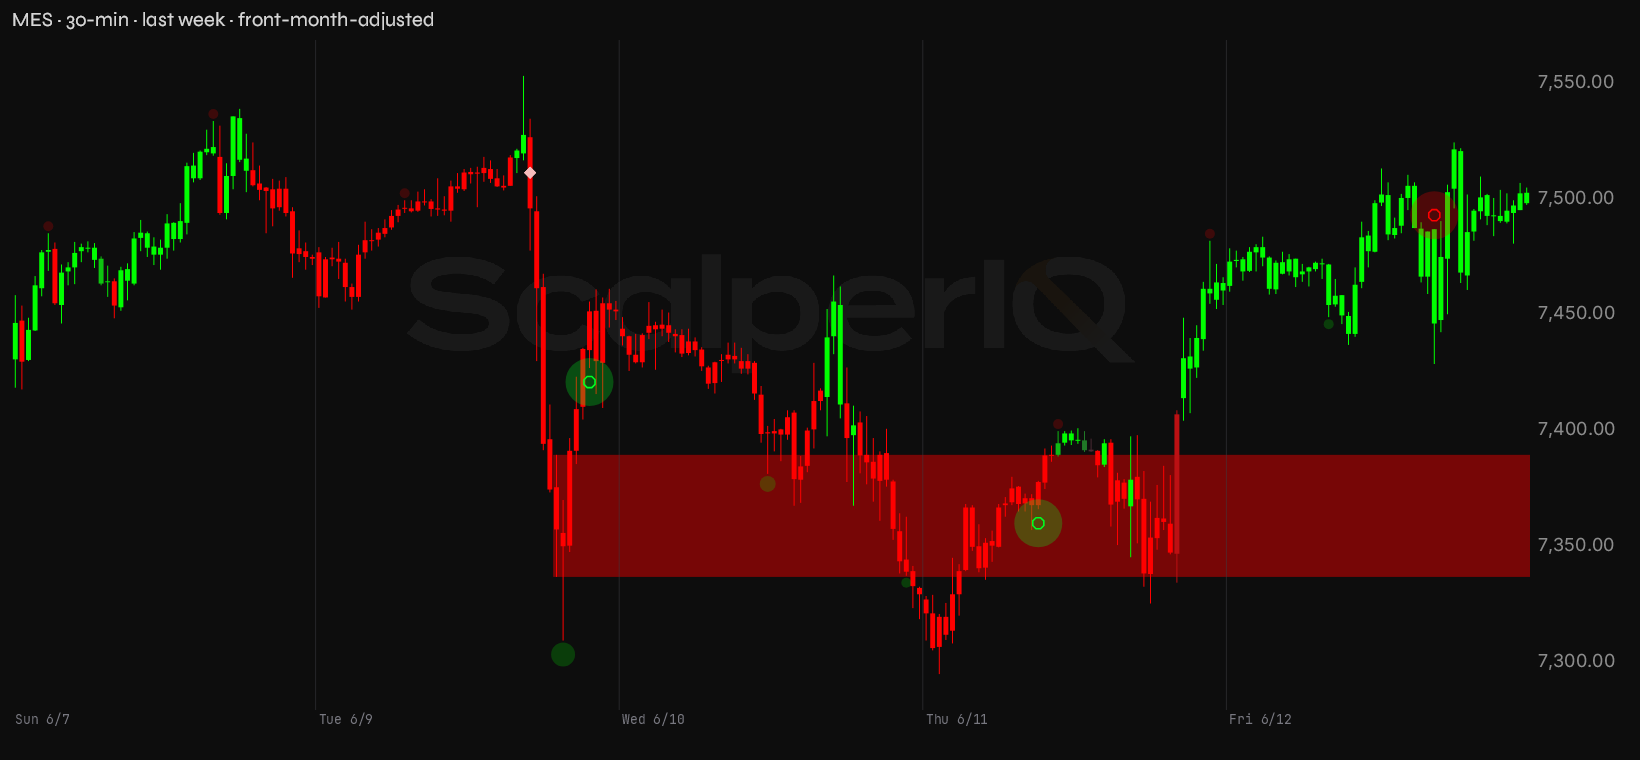
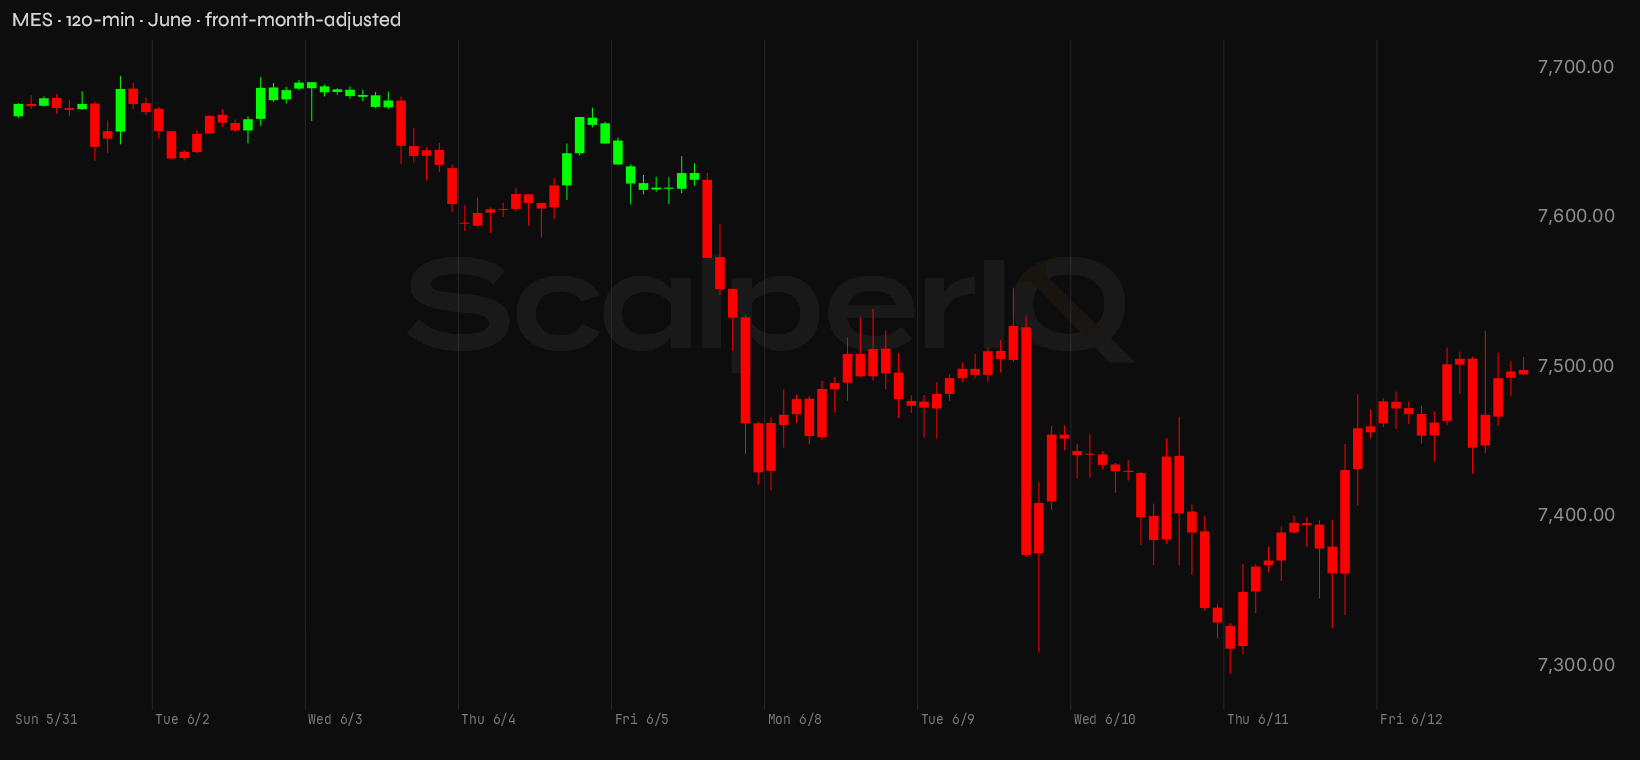
MES told a different story underneath the surface. The week closed with a net delta of −7,929 on a high of 7,553.50 and a low of 7,295.00 — a 258.5-point range where sellers were active on the way up, not just on the way down. The engine's dominant color was red on three of five sessions, including the two biggest-range days. Price recovered, but the tape was selling into every lift.
Quick version: the bias is cautiously long off the Thursday absorption, but June's cumulative delta says somebody has been distributing into this strength all month — and FOMC week is the moment of truth.
The month set the trap
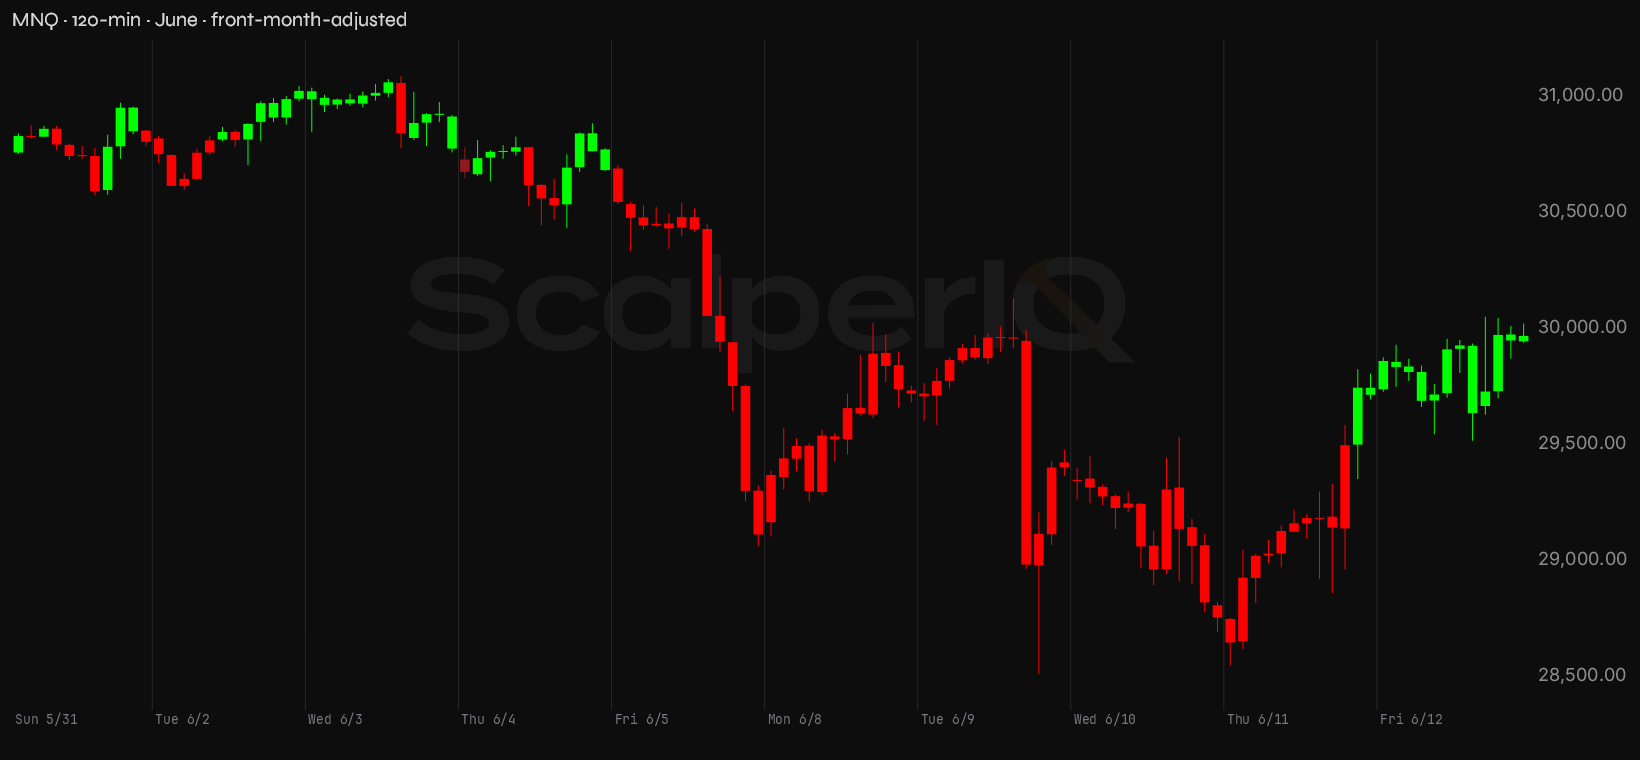
June has been a distribution month wearing an accumulation mask. Price in MNQ has ranged 2,580.5 points, touching 31,092.00 on the high and 28,511.50 on the low. Cumulative net delta for the month: −36,645. That's not a rounding error. Buyers pushed price to new monthly highs while the tape was net-sold almost the entire way. That's the divergence ScalperIQ is built to surface — and it's been flashing in June since the first week.
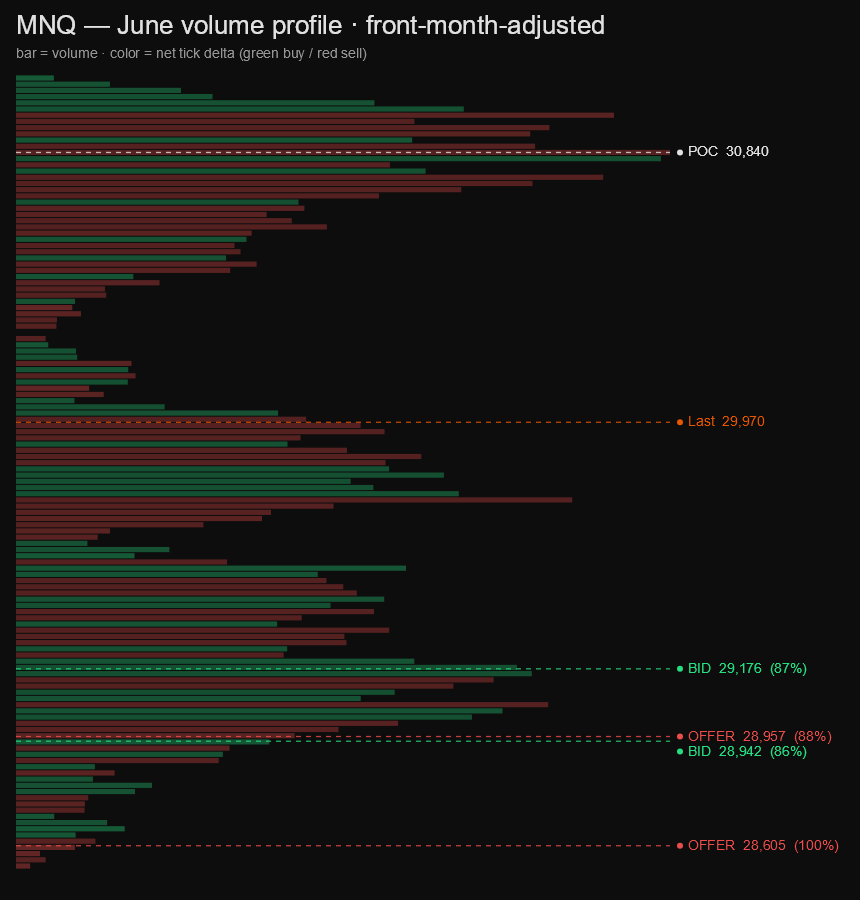
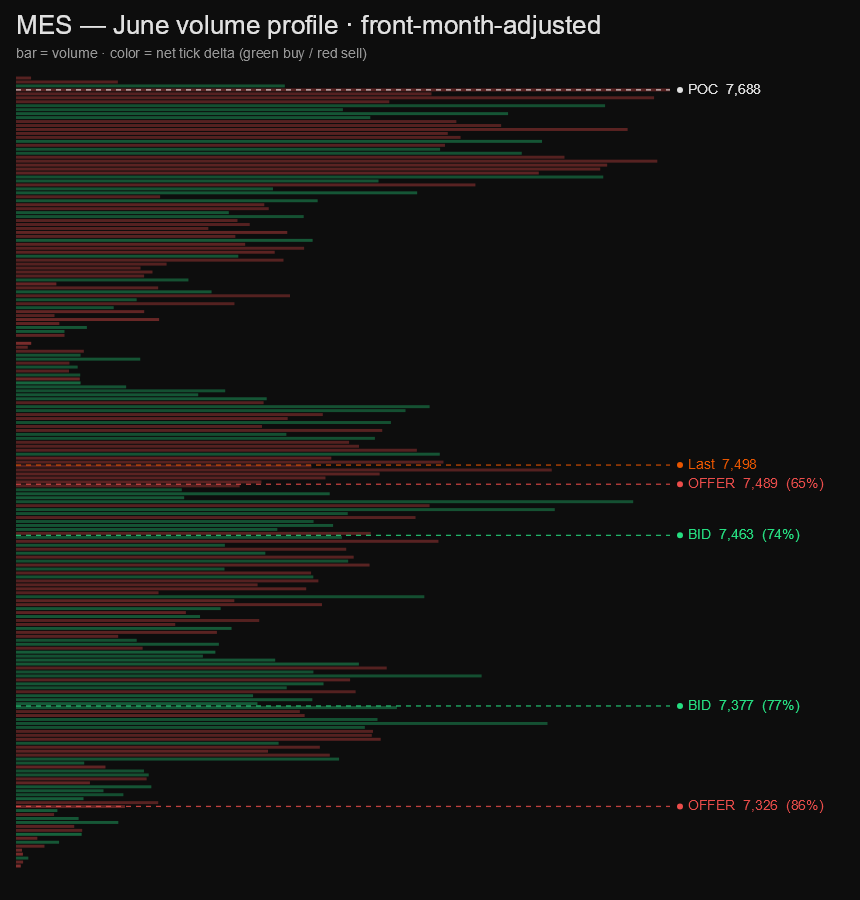
MES runs the same script. Monthly range of 400.25 points, high at 7,695.25, low at 7,295.00. Cumulative delta: −31,483. Three of the five sessions this past week were red-dominant on MES, and the month as a whole has been leaning on the bid. The volume profile for June shows participation concentrated at the upper end of the range — but that participation was predominantly selling, not buying. Someone has been using the bid to exit, not to build.
The divergence hasn't resolved. Price is still elevated relative to where delta says it should be trading. That can mean one of two things: the sellers are wrong and short covering is about to accelerate, or the buyers are running out of road and a flush is coming. FOMC week is the kind of catalyst that forces the answer. What I'm watching for is whether a rally attempt this week produces positive cumulative delta for the first time in June — if it does, the divergence starts to heal and the long thesis earns real backing. If price lifts again on net-sold tape, that's the third consecutive week of distribution into strength, and the trap is still set.
Last week, up close
Thursday, June 11 was the real session. MNQ posted +13,755 delta on a 1,278-point range, opening at 28,749.25 and closing at 29,716.50. That's a genuine buy day — executed buy volume ran hard over sell volume from the open, price followed through, and the close held near the high. That's the kind of session that earns trust. MES on the same day printed −2,511 delta on a 187.25-point range, closing at 7,460.75 after tagging a low of 7,295.00. MES recovered the range but the tape was still net-sold — buyers moved price but sellers were fighting them the whole way. MNQ paid cash on Thursday; MES put it on the card.
The suspect session was Tuesday, June 9. MNQ printed −3,735 delta on the week's widest range — 1,619.75 points, high at 30,131.25, low at 28,511.50, closing at 29,424.75. Price reached the week's high on that session and then sold off nearly 1,600 points intraday. The tape was net-sold on a day that touched the highest print of the week — that's a phantom breakout signature. Buyers couldn't hold the high, sellers took over, and the close was well off the top. MES confirmed: June 9 printed −3,098 delta, also touched the week's high at 7,553.50, and faded back to 7,452.50. Both instruments made their weekly highs on a net-selling session. That's not accumulation at the top — that's distribution.
Wednesday, June 10 extended the damage. MNQ posted −6,291 delta — the most negative single session of the week — on an 841-point range that closed at 28,755.75. MES printed +4,215 delta on June 10, which looks like a contradiction until you see the close: 7,329.50, near the low of the session at 7,318.75. The green delta on MES that day was buyers absorbing into a falling market, not driving it. Friday, June 12 was a quiet recovery — MNQ +798 delta, MES +3,998 delta, both closing near session highs on compressed ranges. The engine colored both green, but the volume behind it was thin. A Friday drift higher on light tape after a week of distribution is not a trend change.
Levels I'm watching
These come from our conviction* zones — price levels where order flow was persistently one-directional across multiple sessions, not lines drawn freehand.
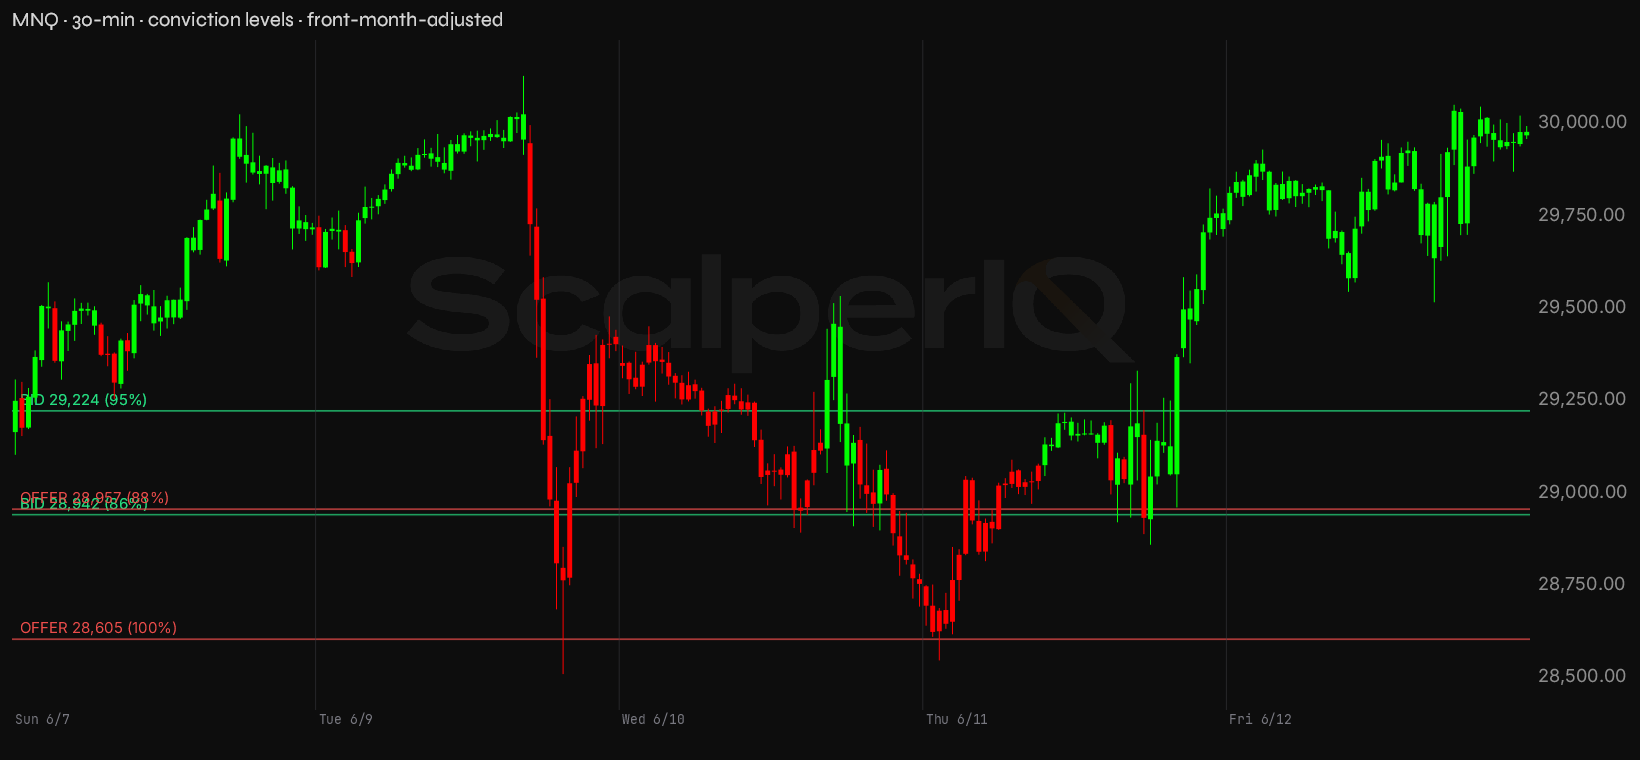
MNQ has four levels that matter into this week. The 28,605 zone carries 100% conviction on the sell side — order flow there was essentially one-directional, all offer, no negotiation. That's the floor of the recent flush and the level the market has to stay above for the long thesis to have any structural support. Just above it, there's a tight battle between a 86% conviction bid shelf at 28,942 and an 88% conviction offer shelf at 28,957 — a 15-point range where buyers and sellers have both planted flags. That cluster is the near-term pivot; how the tape behaves inside it will tell you who's in control. Up at 29,224, there's a 95% conviction bid shelf — nearly one-directional buying — that acted as a launch pad for Thursday's recovery and is now the level to defend on any pullback.
MNQ conviction zones
| Zone | Price | Read |
|---|---|---|
| Re-offer | 28,955–28,961 | Supply shelf — 88% conviction. |
| Re-offer | 28,604–28,608 | Supply shelf — 100% conviction. |
| Bid | 29,222–29,227 | Demand cluster — 95% conviction. |
| Bid | 28,939–28,947 | Demand cluster — 86% conviction. |
| Line in the sand | 28,512 | Last week's low. Lose it and the bounce thesis is done. |
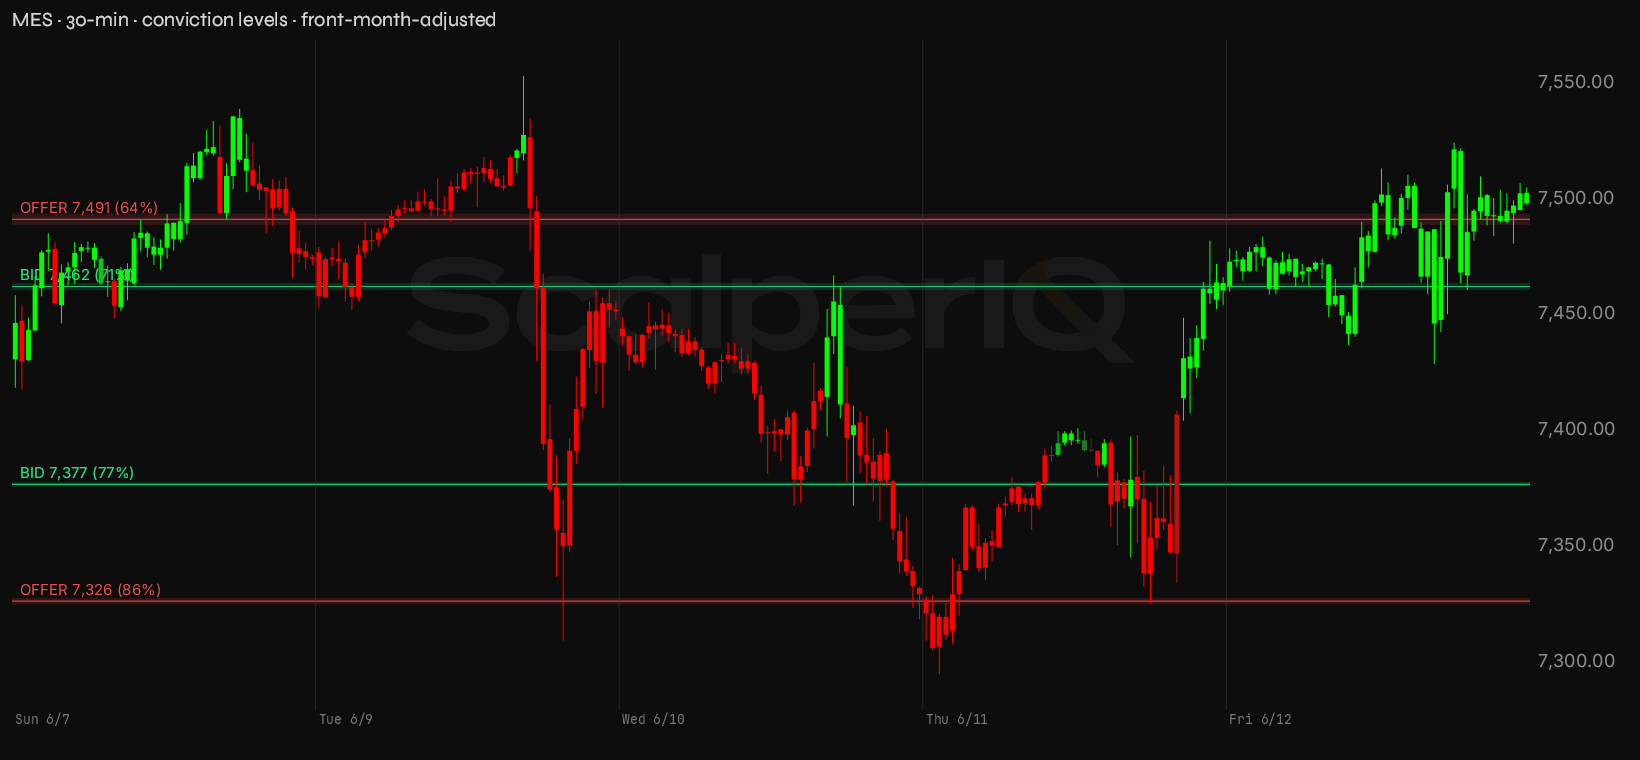
MES has its own stack. The 7,326 zone carries 86% conviction on the sell side — that's where the tape was nearly unanimous in its selling, and it lines up with the week's low cluster. The 7,377 shelf is a 77% conviction bid — buyers showed up there but with less unanimity, meaning it's a softer floor. The 7,462 shelf carries 71% conviction on the buy side — this is the level MES needs to hold on a pullback to keep the recovery intact; it's also where the engine flagged persistent buying across sessions this week. Up at 7,491, there's a 64% conviction offer shelf — the weakest of the four, but still a level where sellers have shown up consistently. That's the near-term ceiling until the tape clears it with positive delta.
MES conviction zones
| Zone | Price | Read |
|---|---|---|
| Re-offer | 7,489–7,494 | Supply shelf — 64% conviction. |
| Re-offer | 7,325–7,328 | Supply shelf — 86% conviction. |
| Bid | 7,461–7,464 | Demand cluster — 71% conviction. |
| Bid | 7,376–7,378 | Demand cluster — 77% conviction. |
| Line in the sand | 7,295 | Last week's low. Lose it and the bounce thesis is done. |
The one thing I need to see this week: a session where price and delta rise together — positive net delta on a green close, both instruments confirming, not one paying cash while the other charges it. June hasn't given us that yet.
Housekeeping: it's roll week
The data rolled NQM6 → NQU6 on Friday, June 12 at 4:00 AM ET. The front month is now NQU6. The roll carried a +284.25-point contango step — that gap is the roll, not a move. If you're looking at a back-adjusted continuous chart, that step is already normalized out. If you're looking at raw contract data side by side, the 284-point gap between NQM6 and NQU6 is mechanical premium, not price action. Do not read it as a breakout. Do not let a stop sitting below the old contract's close get triggered by the roll gap — check your platform's contract settings before Sunday's open. The next roll isn't until the September contract (around Sep 14) — nothing to manage there until then.
On the calendar
The scheduled risk worth timing around this week:
Tuesday, June 16 — FOMC Day 1 + SEP, All Day: The committee is in session all day. Ranges compress and participation thins as algos widen spreads ahead of the decision window. I'm not fighting a slow, thin tape — I'm waiting for the reaction and trading the second move, not the knee-jerk.
Wednesday, June 17 — Retail Sales (May 2026 data), 8:30 AM ET: Consumer spending data hits at 8:30 AM ET and can move MES/MNQ ±10 points in the first minute. I let the initial spike exhaust, wait for a clean delta flip to confirm direction, and size in after the dust settles.
Wednesday, June 17 — FOMC Rate Decision + SEP, 2:00 PM ET; Press Conference 2:30 PM ET: Liquidity evaporates in the 30–60 minutes before the 2:00 PM ET release. I'm flat going into the statement. The real move often prints during the Powell Q&A, not off the headline — I let delta absorb the initial spike before committing size.
Thursday, June 18 — Initial Jobless Claims, 8:30 AM ET: Claims data at 8:30 AM ET. Lower impact most weeks, but elevated readings can shift near-term rate expectations fast; I'm aware around the number and size accordingly.
Bottom line
The bias is cautiously long off Thursday's absorption and the 29,224 / 7,462 bid shelves — but that thesis only holds if this week's rally attempts come with positive delta instead of the net-sold grind that has defined June so far. MNQ leads if the thesis works; it was the only instrument that actually paid cash last week and it's the one to watch for a genuine delta-confirmed move higher. If MES keeps printing negative net delta on up days while MNQ tries to rally, that divergence is the tell — the long case fails and June's distribution pattern reasserts. Into FOMC, I'm not anticipating direction; I'm reading the delta after the announcement and trading the move that earns it.
* Conviction % — how one-sided the order flow was at that price. 100% means it traded essentially one direction; 50% means buyers and sellers fought it to a draw. It's a read on agreement, not size — a decisive level can still be a thin one.
* Delta means raw tick delta — executed buy volume minus sell volume, straight off the tape.
* MNQ / MES are the Micro E-mini Nasdaq-100 and S&P 500 futures — same index price action as the full-size NQ / ES, at a smaller contract size. We read the micros because they're where most retail order flow lives; the delta and volume figures here are micro-contract counts.
Delta Reads are my own read of the order flow, not financial advice. Trade your own plan.
Get the Delta Reads
Our weekly order-flow read on MES and MNQ — what the tape did, and the levels we're watching next. One email a week. No noise.
See what ScalperIQ looks like on a live chart.
Try Free for 14 DaysNo credit card required. Available on MotiveWave, EdgeProX, and NinjaTrader.