
Delta Read · Week of September 7, 2026 — Four Sessions Hit the Bid and Friday's Recovery Didn't Change the Count
Get the Delta Reads
Our weekly order-flow read on MES and MNQ — what the tape did, and the levels we're watching next. One email a week. No noise.
Published Monday, September 14. This is Friday's read, and Monday's session is already running against part of it. Every level below is measured from the September 11 close. Since then NQ has traded through both the 29,164 bid shelf and the 29,040 line in the sand, the level I named as the point where I'd step back and reassess the bounce, with a session low of 28,816.25 as of midday. ES is holding just above its own 7,586 line, 7,593.75 at the session low so far. The lean below is the one that played out, and NQ led it down the way this read says it would. What is stale here is the “where price sits now” framing, not the conclusion. Everything below stands as of Friday's close.
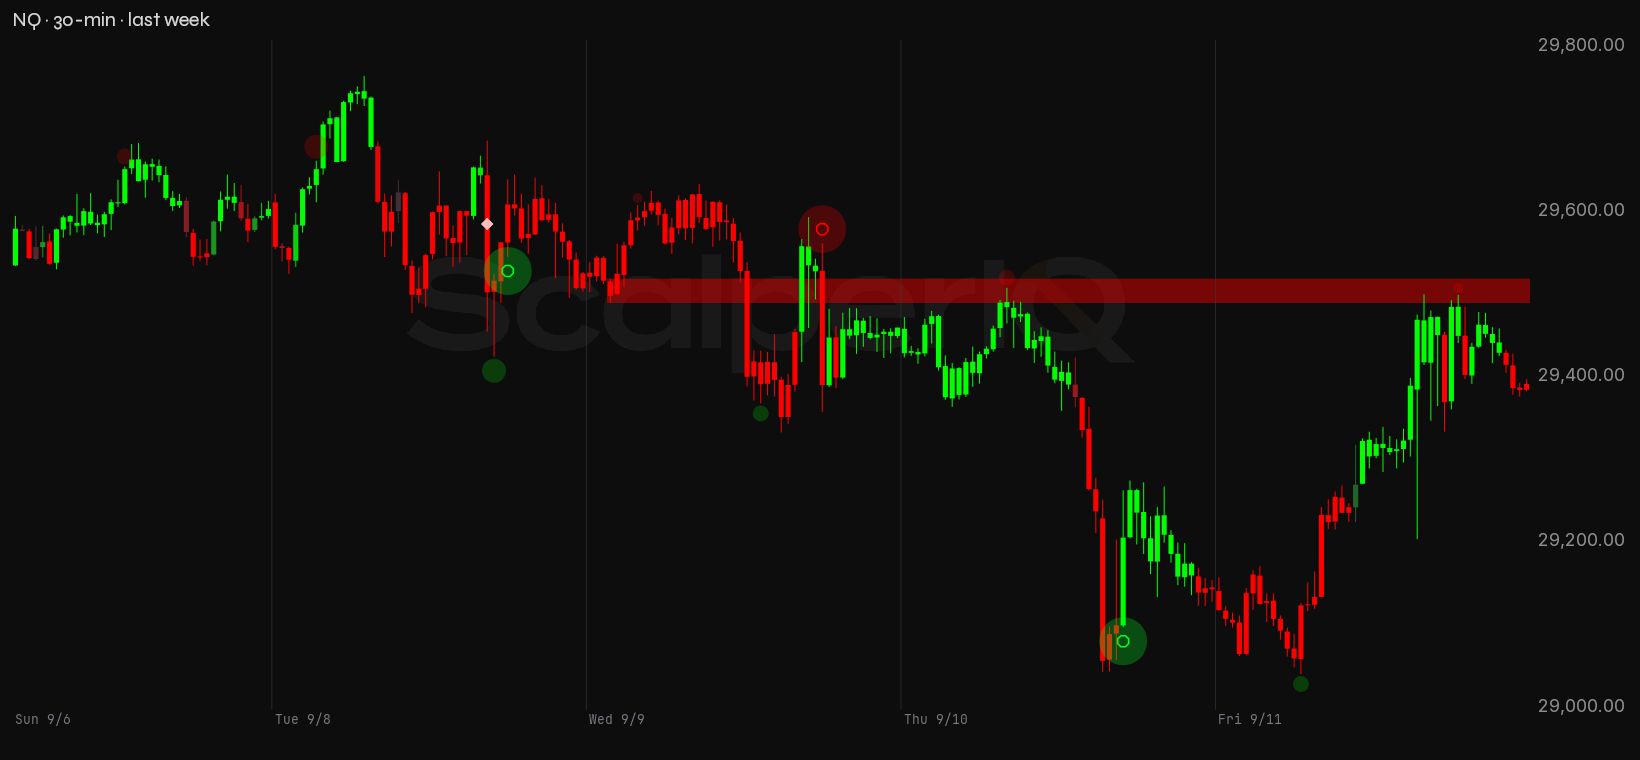
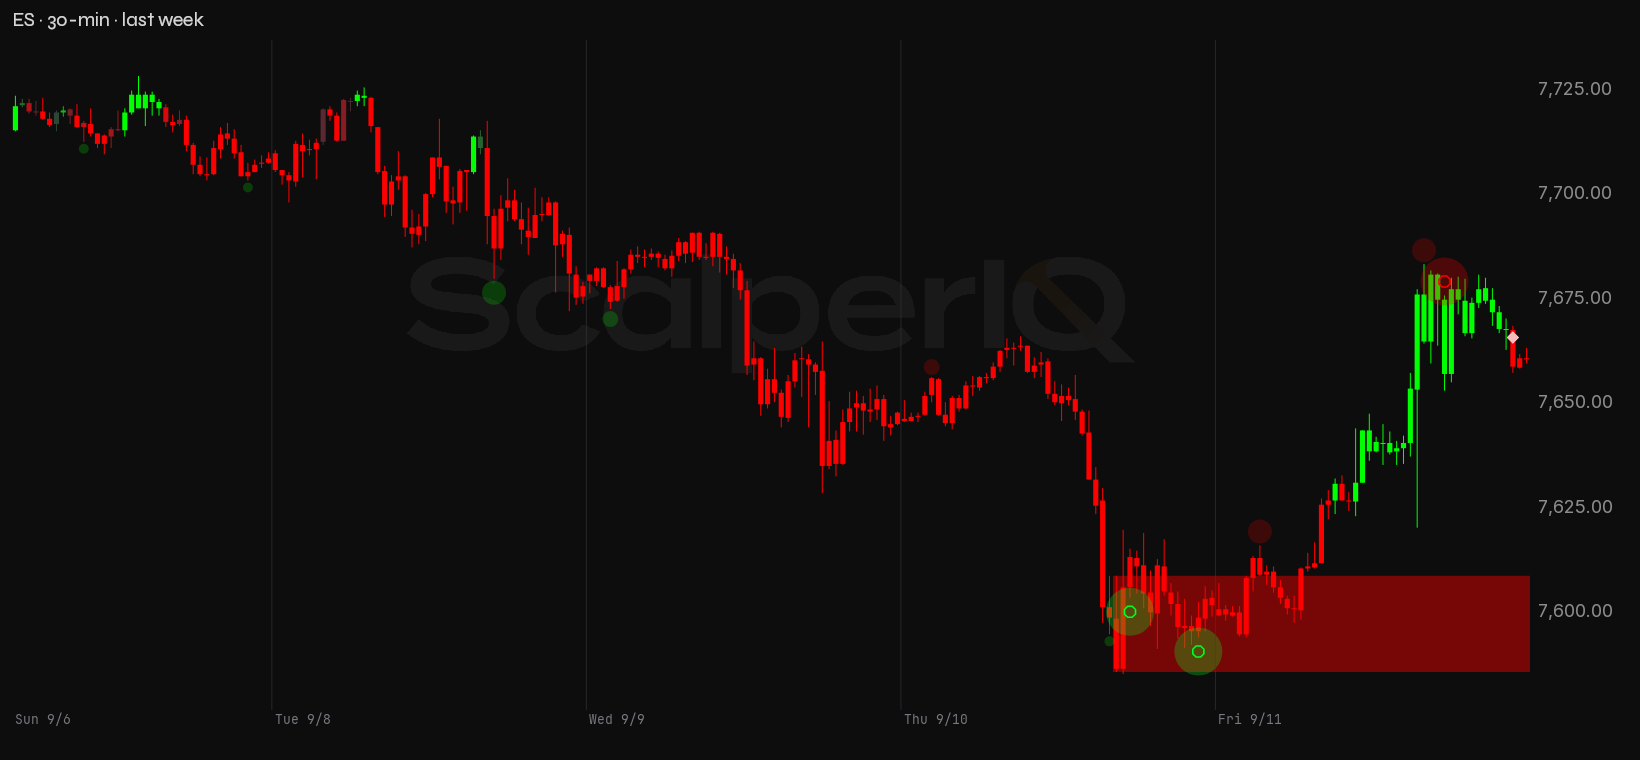
Last week's forward watch was a specific condition: NQ holding above the 29,507 weekly shelf on a pullback test, with sell delta contracting on the approach rather than accelerating through it. That condition can't be evaluated cleanly off the tape, because the week's structure never produced an isolated pullback test at that level, so I'm picking up the thread qualitatively. What actually happened was the opposite of the watch: NQ broke through 29,507 on Tuesday and never reclaimed it as support. The prior bias on both instruments resolved mixed. NQ's line in the sand at 28,927.25 held, with the week's low of 29,040.5 never threatening it, but every level in the prior set broke in one direction or another before Friday's close. ES's line in the sand at 7,618.50 was lost, with Thursday's low of 7,585.50 pushing well through it before the tape recovered.
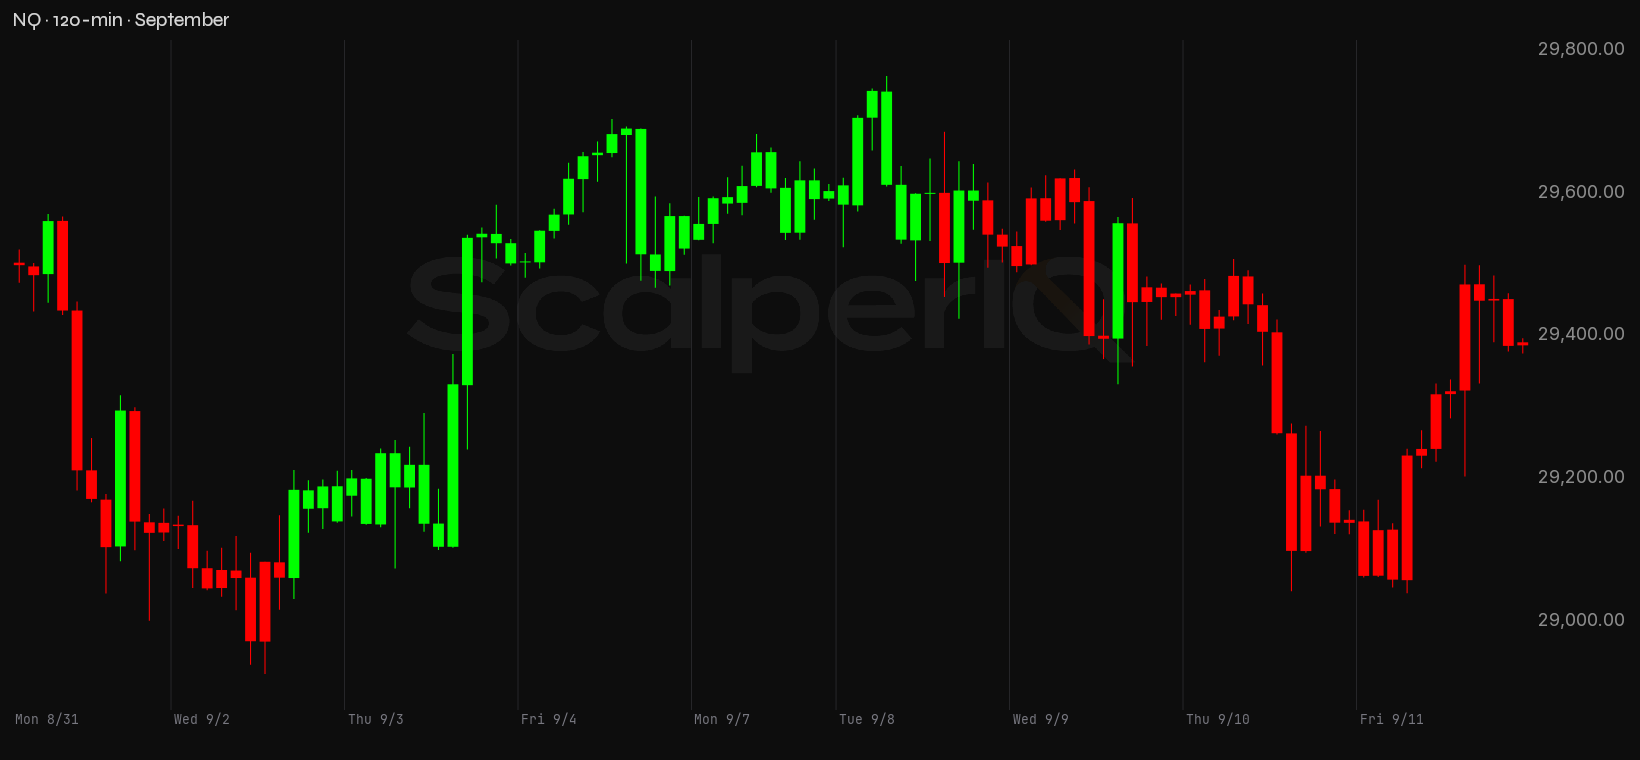
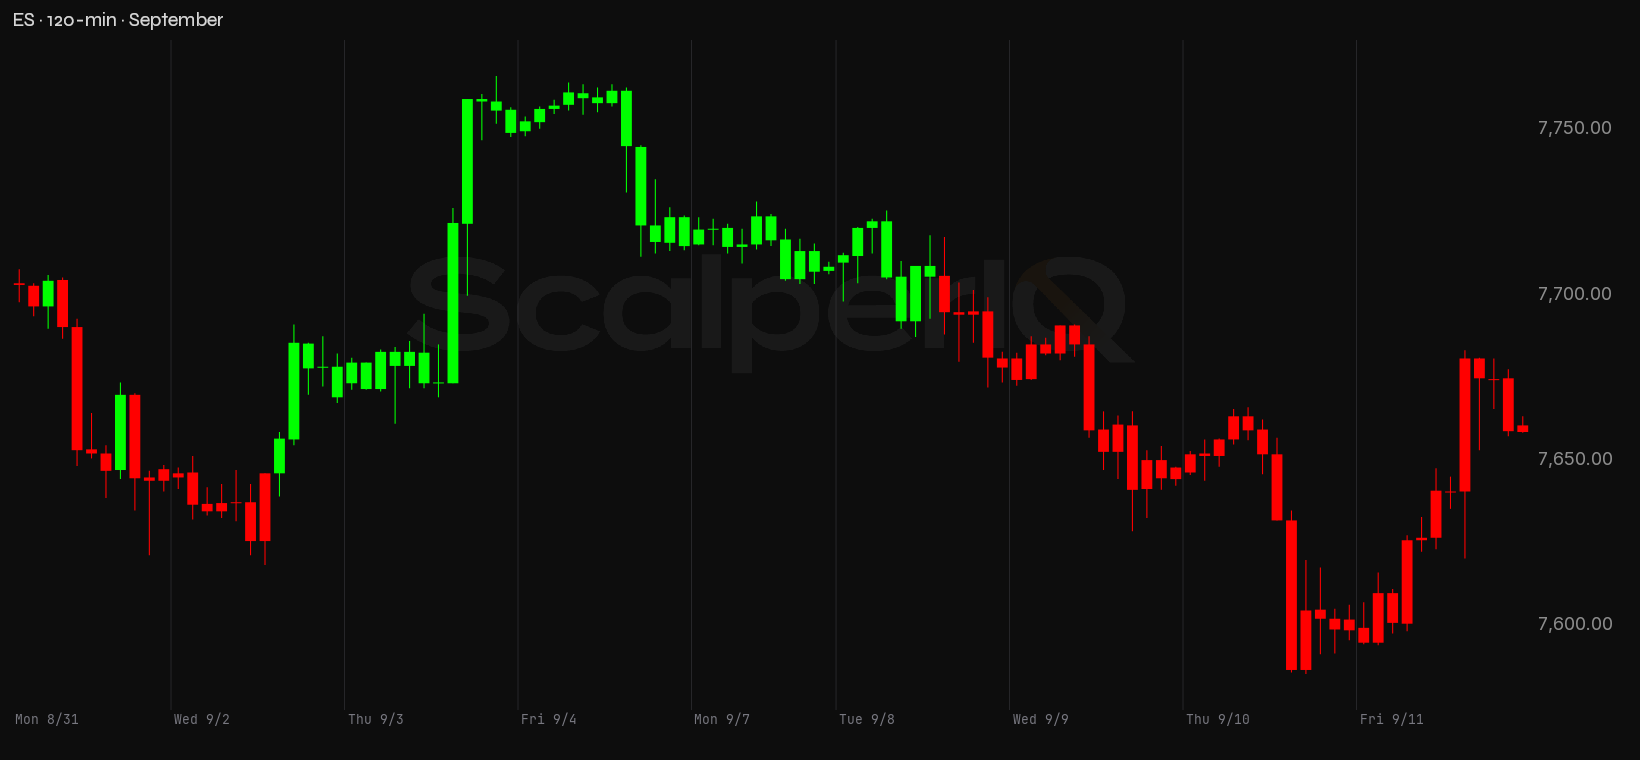
NQ closed the week at 29,391.75, down 131.25 points from the prior Friday's 29,523. ES closed at 7,660.75, off 54.25 from 7,715. The quick version: the tape leaned on the bid all week, Friday's bounce was real in price but not in delta, and NQ is sitting three points below a weekly offer shelf heading into an FOMC week.
September Has NQ Below Its Monthly POC and ES Above Its Own — Same Delta Lean, Different Posture
Nine sessions into September and cumulative delta is already in the red on both instruments, NQ at −14,810 and ES at −5,614, while price has stayed range-bound rather than breaking down. That's the tension the month is building. Sellers have been leaning on the bid consistently, but the bids are absorbing it. Neither instrument has resolved the divergence yet.
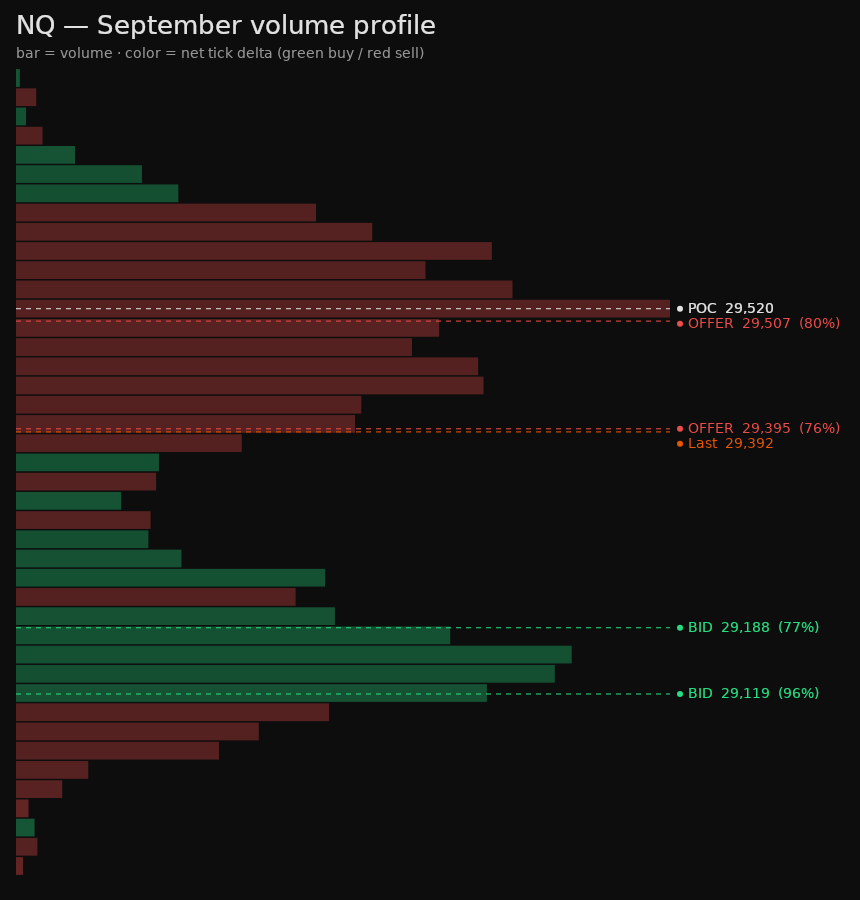
On NQ, the month's point of control sits at 29,520, above the current close of 29,391.75. Price has drifted below where the most volume traded this month, which means the market spent the bulk of September's early sessions in a zone it's now trading under. That's not a catastrophic read, but it's not a healthy one either. The negative cumulative delta running alongside a price that hasn't collapsed suggests absorption at work: sellers hitting the bid, buyers taking the other side without urgency.
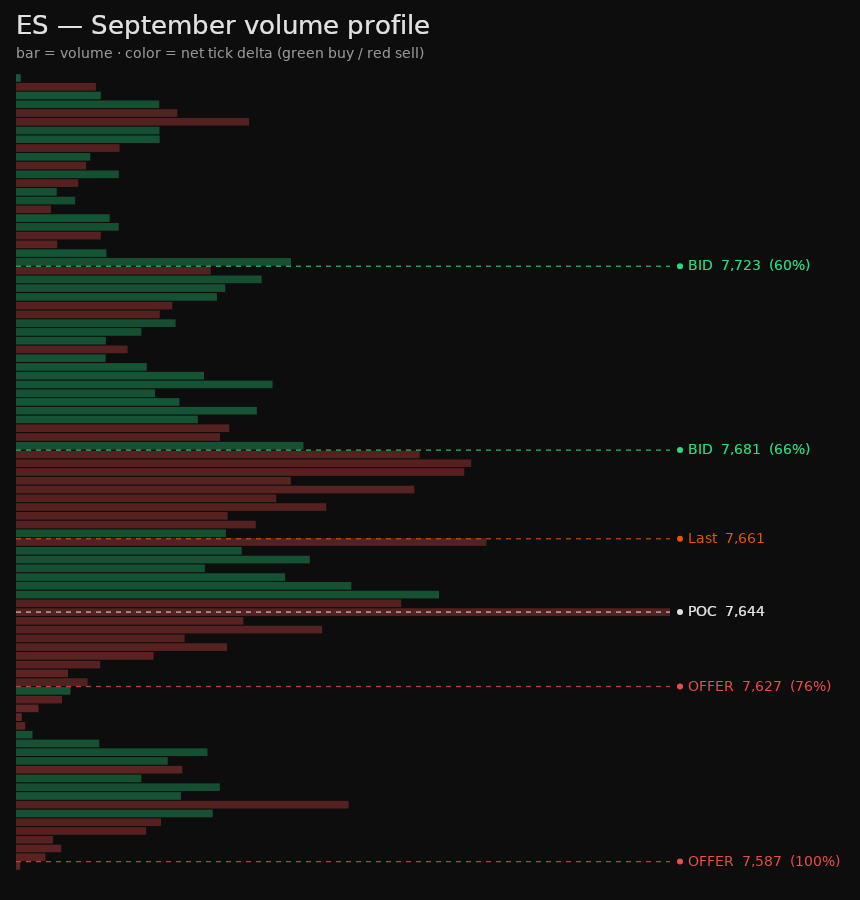
ES tells a slightly different story. Its monthly point of control is at 7,644, which is 17 points below the current close of 7,660.75. Price is sitting above where the most volume traded, which is the more constructive posture of the two. But ES's cumulative delta is also negative on the month, and Friday's session, the one that closed green, printed −18,213 delta, the most aggressive selling ES saw all week. A close above the POC on heavy sell delta is the kind of divergence that tends to resolve, one way or the other.
Last Week, Up Close
Monday, September 7 was Labor Day, and CME equity-index futures closed early at 12:00 PM CT. NQ's −332 delta and tight 153-point range on that session is the holiday close, not a signal. ES was similarly quiet, posting +3,503 delta in a 25-point range. Nothing to read there.
Tuesday was where the week's character got established. NQ printed −9,717 delta, its largest print of the week by a wide margin, on a session that opened at 29,611.50, tagged 29,764.75 (the week's high), and then sold 239 points off that high to close at 29,525.75. The tape lifted the offer to the week's high and then sellers ran it back down hard. ES on the same session posted +25,441 delta, its own largest print of the week, and closed down 31.75 points. Two instruments, same session, opposite delta. That is the split the rest of the week kept circling.
Wednesday softened the picture a little. NQ's only positive-delta session of the week: +3,661, closing down 66.50 points. The tape was buying but price was still fading, with buyers stepping in and not enough of them to hold the close. ES added +9,879 delta and also closed lower, down 33 points. Both instruments absorbing, neither recovering.
Thursday broke down. NQ dropped 315.25 points on −1,019 delta, a relatively modest print for the size of the move. That suggests the selling was more passive than aggressive: price falling through thin bids rather than sellers hammering it. ES shed 44.50 points on −3,571 delta, its first negative-delta session of the week. NQ's low of 29,043.25 came within three points of the week's ultimate low.
Friday closed green on both instruments, NQ up 250.75 points and ES up 61.25, but the delta told a different story. NQ posted −3,998 and ES printed −18,213, the most aggressive selling of the week on ES. Price bounced 351.25 points off NQ's week low of 29,040.50 and 66.50 points off ES's 7,594.25 low, but the buyers doing the lifting weren't lifting the offer. The delta says sellers were still hitting the bid while price recovered. That's short covering, not fresh demand.
To put the week in numbers: NQ closed four of five sessions with negative delta, one positive (Wednesday). ES ran three positive-delta sessions, Monday through Wednesday, and two negative ones on Thursday and Friday.
Levels I'm Watching
Every level below comes from measured order flow: where executed buy and sell volume was one-sided enough to leave a mark on the tape. The first time I use the word conviction* here, it's pointing at the footnote that defines what that percentage actually measures.
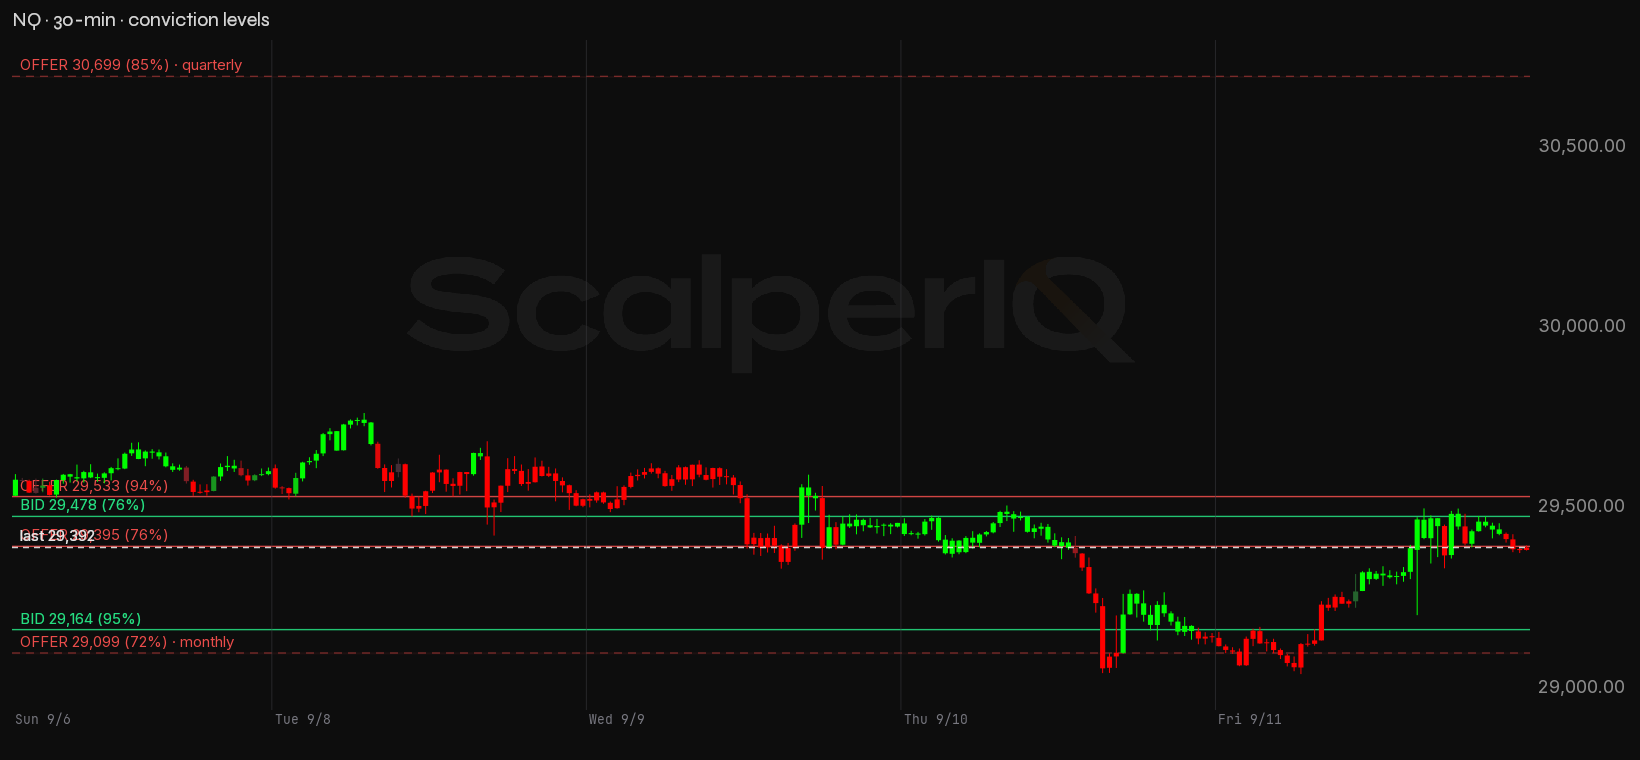
NQ conviction zones
| Zone | Price | Read |
|---|---|---|
| Re-offer (quarterly) | 30,699 (30,699–30,700) | Supply shelf — 85% conviction. |
| Re-offer | 29,533 (29,531–29,537) | Supply shelf — 94% conviction. |
| Re-offer | 29,395 (29,394–29,398) | Supply shelf — 76% conviction. |
| Re-offer (monthly) | 29,099 (29,095–29,101) | Supply shelf — 72% conviction. |
| Bid | 29,478 (29,477–29,480) | Demand cluster — 76% conviction. |
| Bid | 29,164 (29,161–29,167) | Demand cluster — 95% conviction. |
| Line in the sand | 29,040 | Last week's low — losing it is where I'd step back and reassess the bounce. |
NQ's signal set has four levels above the close and two below. The most urgent one is the weekly offer shelf at 29,395, sitting just 3 points above the close of 29,391.75, essentially right on top of price. That shelf carries 76% conviction* and printed −1,881 net delta, with sellers leaning on the bid there. Above it, the weekly bid shelf at 29,478 is 87 points up (76% conviction), and the weekly offer shelf at 29,533 is 142 points out with 94% conviction, the highest-conviction supply in the set. The monthly offer shelf at 29,099 sits 293 points below the close, and the weekly bid shelf at 29,164 is 228 points below at 95% conviction, the highest-conviction level in the NQ set. The quarterly offer shelf at 30,699 is 1,307 points above; that's the broader ceiling.
What price runs into first in each direction: overhead, the weekly offer shelf at 29,395 is 3 points away, and NQ is essentially parked under it. Downside, the nearest demand is the weekly bid shelf at 29,164, 228 points below.
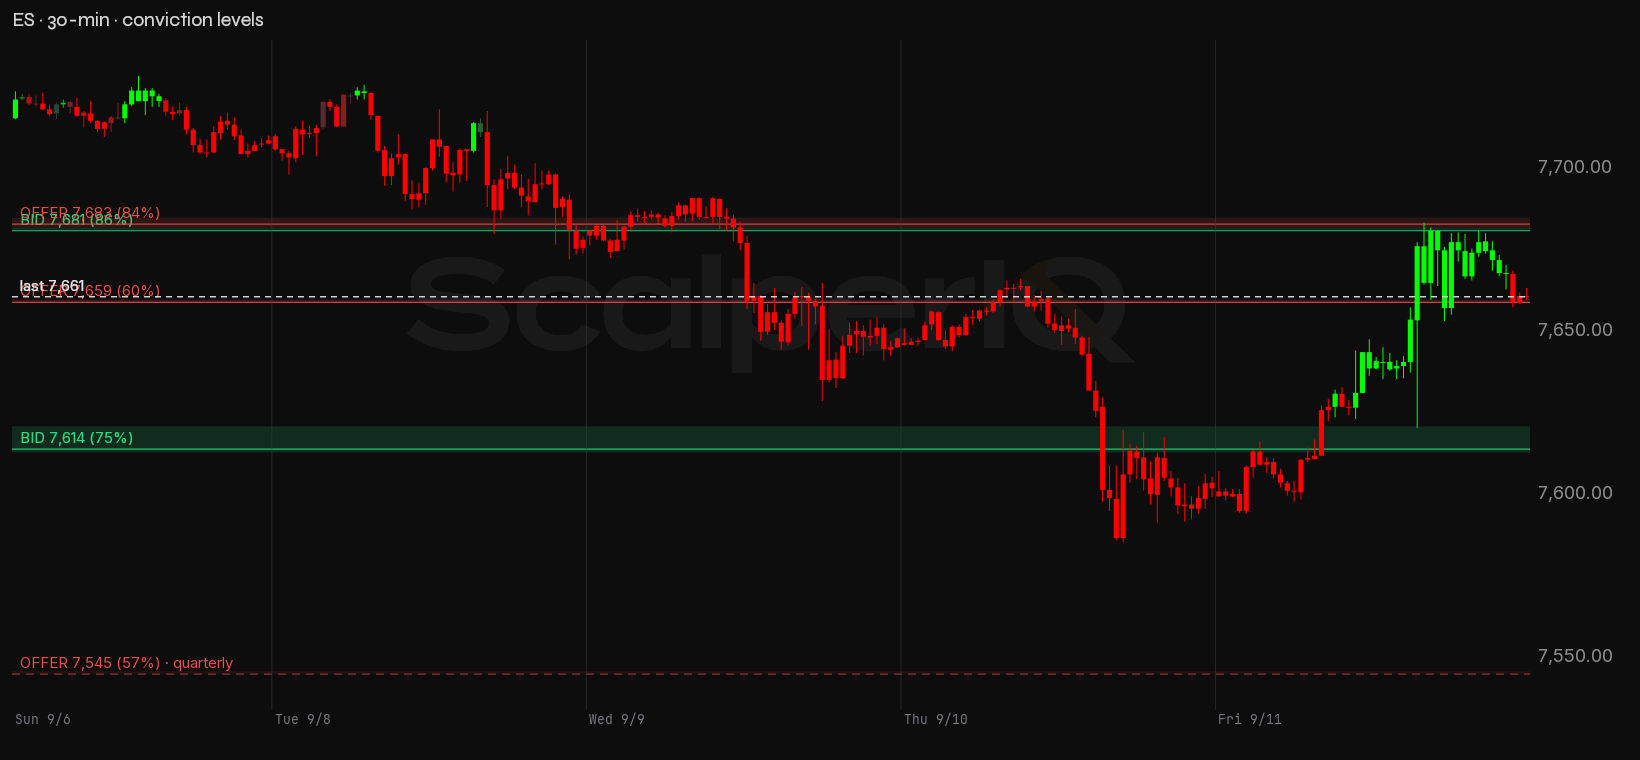
ES conviction zones
| Zone | Price | Read |
|---|---|---|
| Re-offer | 7,683 (7,682–7,685) | Supply shelf — 84% conviction. |
| Re-offer | 7,659 (7,659–7,660) | Supply shelf — 60% conviction. |
| Re-offer (quarterly) | 7,545 (7,545–7,546) | Supply shelf — 57% conviction. |
| Bid | 7,681 (7,681–7,682) | Demand cluster — 86% conviction. |
| Bid | 7,614 (7,613–7,621) | Demand cluster — 75% conviction. |
| Line in the sand | 7,586 | Last week's low — losing it is where I'd step back and reassess the bounce. |
ES has two levels above the close and three below. The nearest overhead is the weekly bid shelf at 7,681, just 20 points up with 86% conviction. Buyers were lifting the offer there, so that is demand sitting above price rather than supply, and the question on a retest is whether those buyers defend it again or use it to get out. Right beside it is the weekly offer shelf at 7,683, 22 points above at 84% conviction. That's a two-point band of opposing order flow sitting 20–22 points above the close, a compressed zone price will have to work through. Below the close, the weekly offer shelf at 7,659 is only 2 points down (60% conviction), the weekly bid shelf at 7,614 is 47 points below at 75% conviction, and the quarterly offer shelf at 7,545 is 116 points below at 57% conviction.
The first level ES meets on the downside is the weekly offer shelf at 7,659, 2 points below the close. That is supply below price, not support: sellers dominated at that price, and the week's last three sessions all traded through it. ES is sitting right on top of a level, the same as NQ.
The single thing that would shift this read: NQ closing a full session above 29,533 on positive net delta, buyers lifting the offer through that weekly supply cluster rather than price drifting through on thin flow. Until that happens, the tape is telling me the bounce is borrowed.
Housekeeping (Roll)
The contract roll lands in the week ahead. NQ rolls to NQZ6 around September 14, and your platform's front month will jump to the new contract. If you're watching NQ and the price suddenly looks different, that's the roll, not a move. ES rolls on the same cycle. Plan for it before Monday's open.
On the Calendar
The week ahead is the most event-dense stretch of the quarter: four prints across three days, with FOMC anchoring the middle of it.
- Tuesday, September 15 — FOMC Day 1 + SEP: The committee is in session all day. Ranges tend to compress and participation thins as the book waits on Wednesday's 2:00 PM ET decision. Expect a quieter tape with occasional sharp moves as positioning adjusts.
- Wednesday, September 16 — Retail Sales (Aug 2026 data), 8:30 AM ET: A miss or beat can swing the tape several points in the first minute, with jumpy two-sided flow around the print.
- Wednesday, September 16 — FOMC Rate Decision + SEP, 2:00 PM ET: Rate decision at 2:00, press conference at 2:30. Liquidity typically thins 30–60 minutes before the release. The sharpest order-flow swings often come during the Powell Q&A rather than the statement itself, and the tape can gap and reverse multiple times in that window.
- Thursday, September 17 — Initial Jobless Claims, 8:30 AM ET: Usually background noise this close to an FOMC, though a surprise print can put a short, sharp move through the first few minutes.
Two of the four events print at 8:30 AM ET, one is all-day, and one lands at 2:00 PM ET.
Bottom Line
NQ is sitting three points below a weekly offer shelf at 29,395, with four of five sessions this week printing negative delta and Friday's bounce built on short covering rather than fresh buying. ES is in a similar spot: two points above the 7,659 offer shelf, and 20 points below a band at 7,681–7,683 where demand and supply are stacked against each other. The lean is neutral-to-cautious heading into the Week of September 14, 2026, with the bias holding only while NQ stays above the 29,164 bid shelf on drying sell delta. NQ answers first on the upside. If it clears 29,533 on genuine positive delta, the picture changes. If it can't get through 29,395, ES's overhead at 7,681 won't matter because the lead instrument will have already answered the question. FOMC mid-week means the tape could compress and then gap hard in either direction before the levels get a clean test.
* Conviction % — how one-sided the order flow was at that price. 100% means it traded essentially one direction; 50% means buyers and sellers fought it to a draw. It's a read on agreement, not size — a decisive level can still be a thin one.
* Delta means raw tick delta — executed buy volume minus sell volume, straight off the tape.
* NQ / ES are the full-size E-mini Nasdaq-100 and S&P 500 futures. We read the full-size contracts because that's where the institutional order flow trades; the delta and volume figures here are full-size contract counts. If you trade the micros (MNQ / MES), the price levels map across one-for-one — they track the same index.
Delta Reads are my own read of the order flow — informational only, not financial advice and not a recommendation to buy or sell anything. Trading futures is not suitable for all persons: it carries a substantial risk of loss, and you can lose more than your initial investment. This is my interpretation of the data and it can contain errors — in the data, in the analysis, or both. Do your own due diligence and trade your own plan.

Get the Delta Reads
Our weekly order-flow read on MES and MNQ — what the tape did, and the levels we're watching next. One email a week. No noise.
See what ScalperIQ looks like on a live chart.
Try Free for 14 DaysNo credit card required in the US (outside the US, a card is required to start). Available on MotiveWave, EdgeProX, and NinjaTrader.