
Delta Read · Week of August 31, 2026 — The Week's Biggest Print Came at the Week's High
Get the Delta Reads
Our weekly order-flow read on MES and MNQ — what the tape did, and the levels we're watching next. One email a week. No noise.
Published Tuesday, September 8. I wrote this Friday evening and it is going out three days late. Two sessions have traded since, and they have already answered part of it. NQ has not been back to 29,507; the lowest it has traded since Friday's close is 29,525, so the test the forward watch asks for never happened. Price went the other way instead, up through the 29,563 monthly bid shelf, closing at 29,603.5 on Monday and 29,743.75 on Tuesday. The condition I set was clearing 29,563 on positive delta. Monday printed −332 and Tuesday −379. NQ is in front on price without the flow that was supposed to confirm it, which is the more interesting outcome. Everything below stands as of Friday's close.
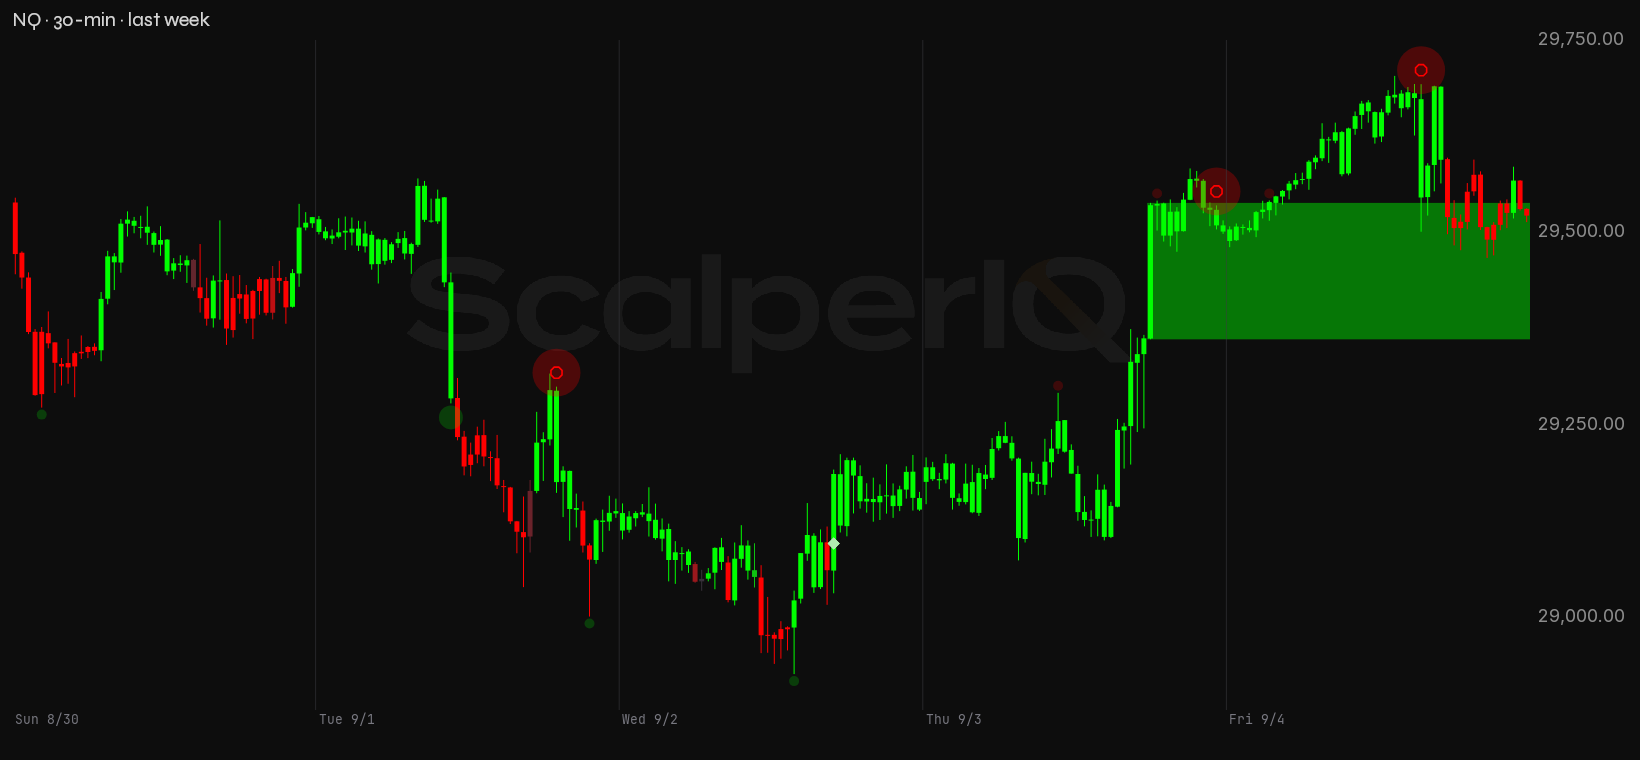
Last week's forward watch had a specific condition: NQ closing above 29,573 on a session where net delta was positive. Buyers lifting the offer through that weekly supply shelf, not price gapping through on thin pre-market flow. It never triggered. NQ spent most of the week below that level, and when it finally tagged 29,584.25 on Thursday, it didn't close there. Friday pushed to 29,704.5, the week's high, and then the tape handed back nearly all of it, closing at 29,523. The bias from last week resolved mixed on both instruments: NQ's line in the sand at 28,946.75 was lost intraday on Wednesday before buyers recovered the session, and every level in the prior set broke in one direction or another before the week was done.
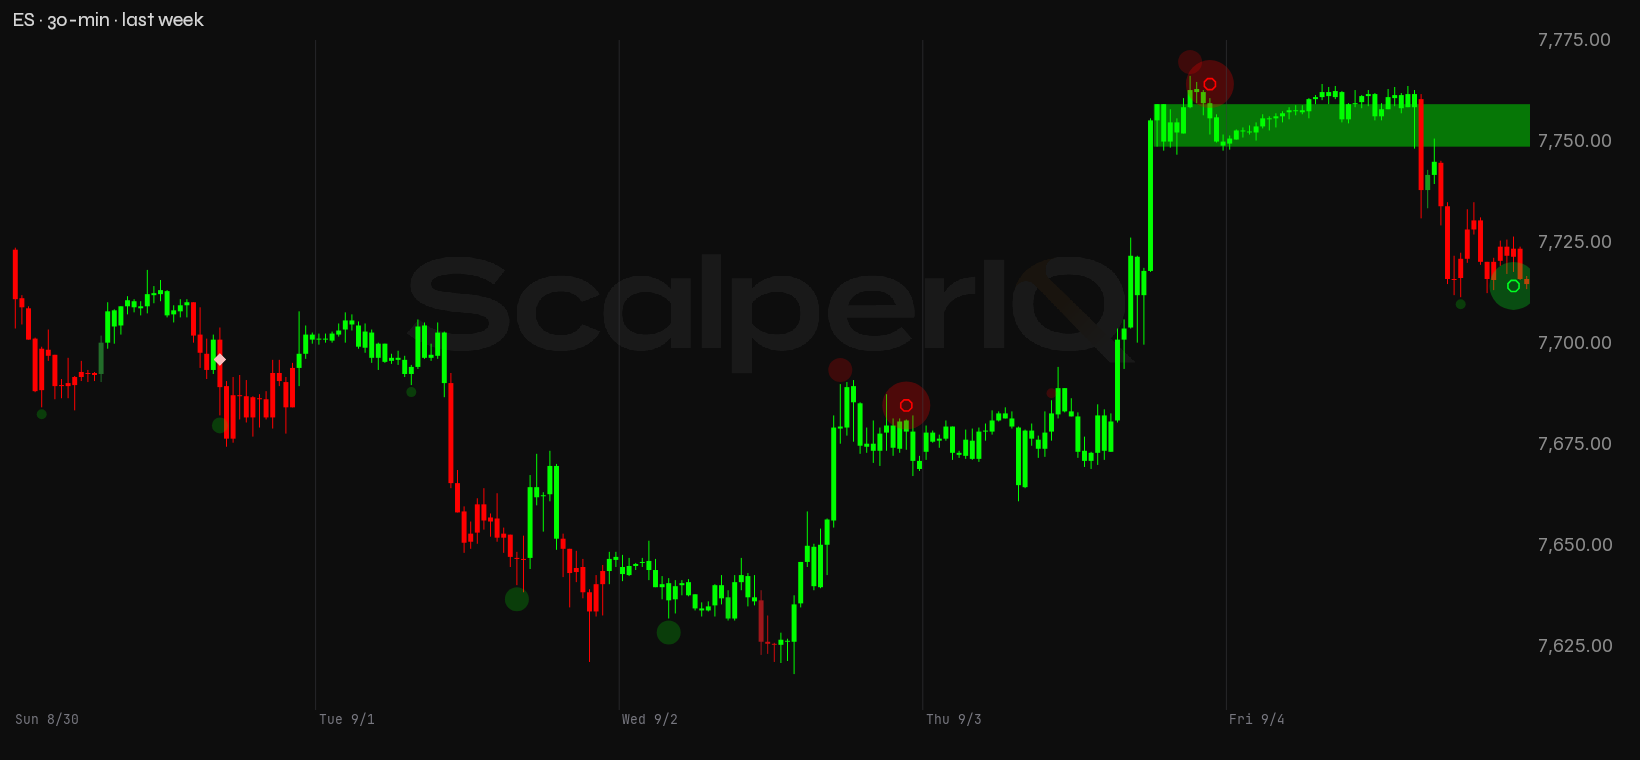
Here's the week on a 30-minute chart with the order flow marked up. NQ closed Friday at 29,523, up just 13.5 points from the prior week's close of 29,509.5. ES closed at 7,715, down 9.75 on the week. NQ tagged its weekly high on Friday and faded; ES had already set its weekly high on Thursday and spent Friday failing to get back to it. The quick version: the week looked constructive right up until it didn't, and Friday's order flow is the reason this read opens with a question mark rather than a green light.
August Ran Positive Delta on NQ and Negative on ES — Same Complex, Different Tapes
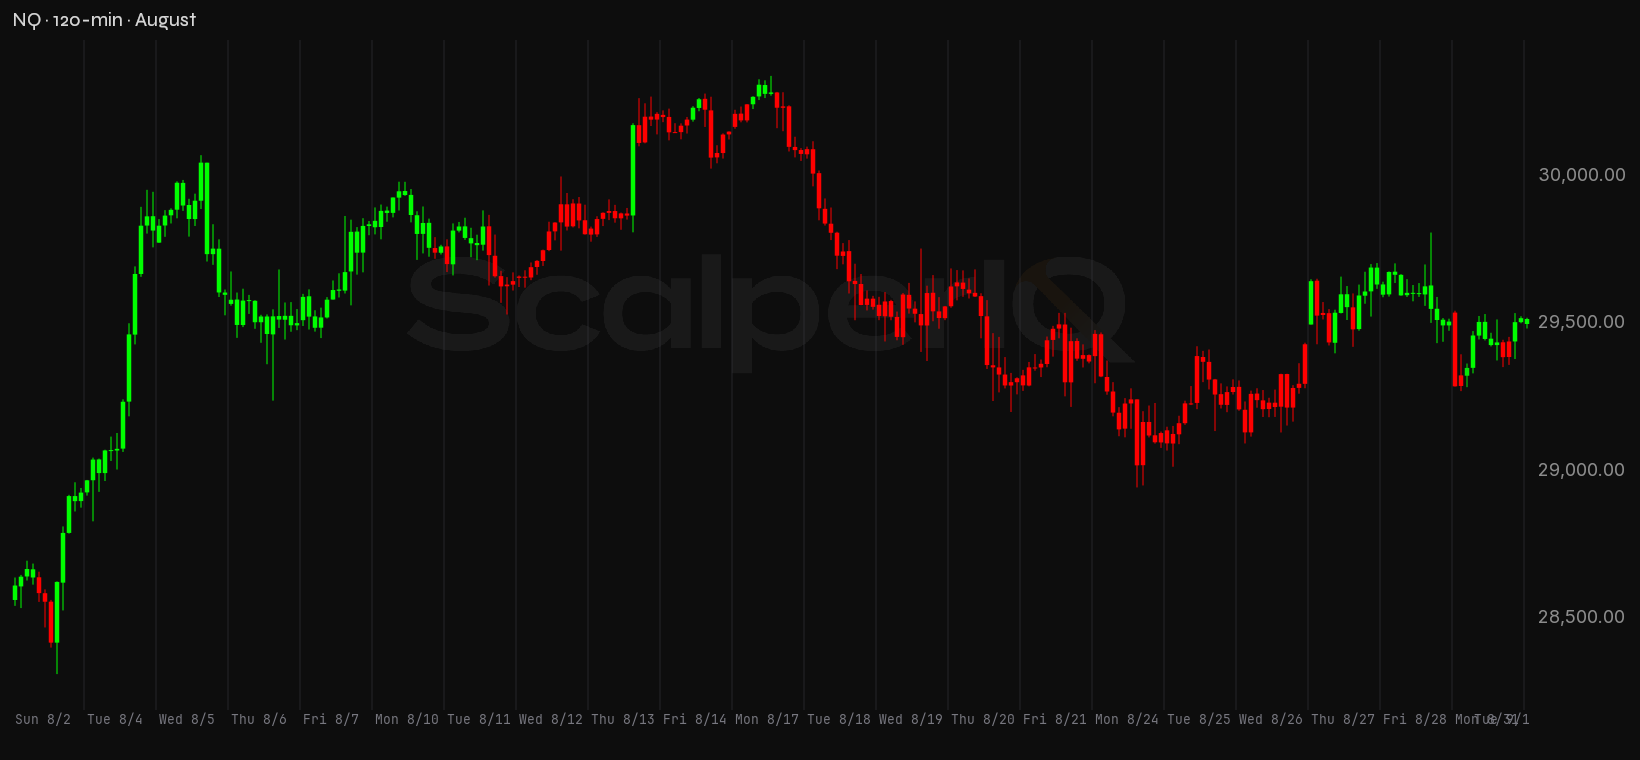
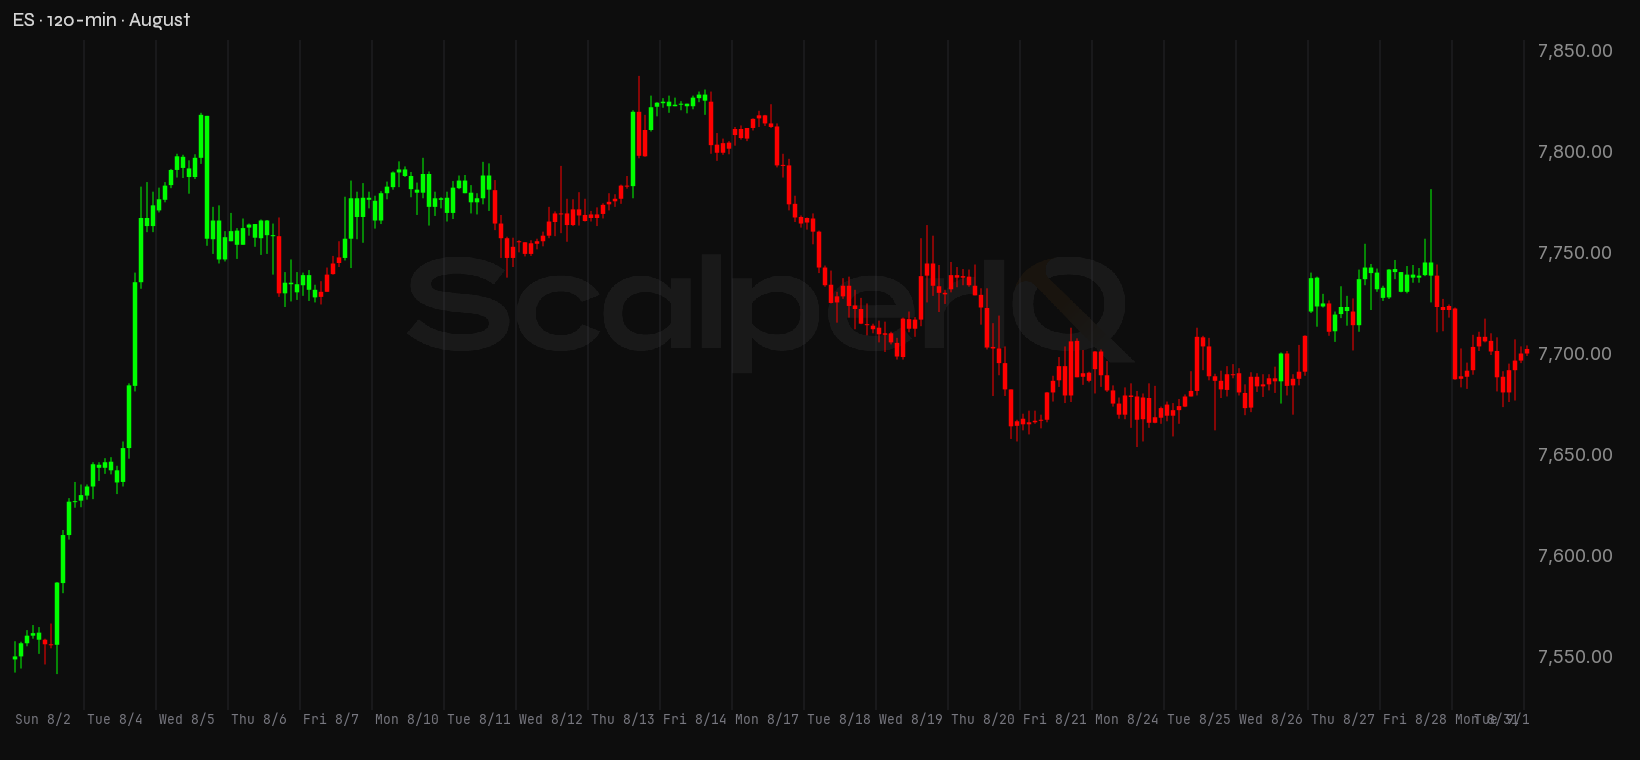
August is done, and the month-end picture is worth sitting with before we move on. NQ ran a +69,301 cumulative delta on the month. Buyers were lifting the offer across August, and the net lean was clearly positive. ES ran the opposite: −8,337 cumulative delta for the month, sellers hitting the bid while price oscillated in a 295.75-point range. Same equity complex, same macro backdrop, two instruments telling different stories about who was doing the work.
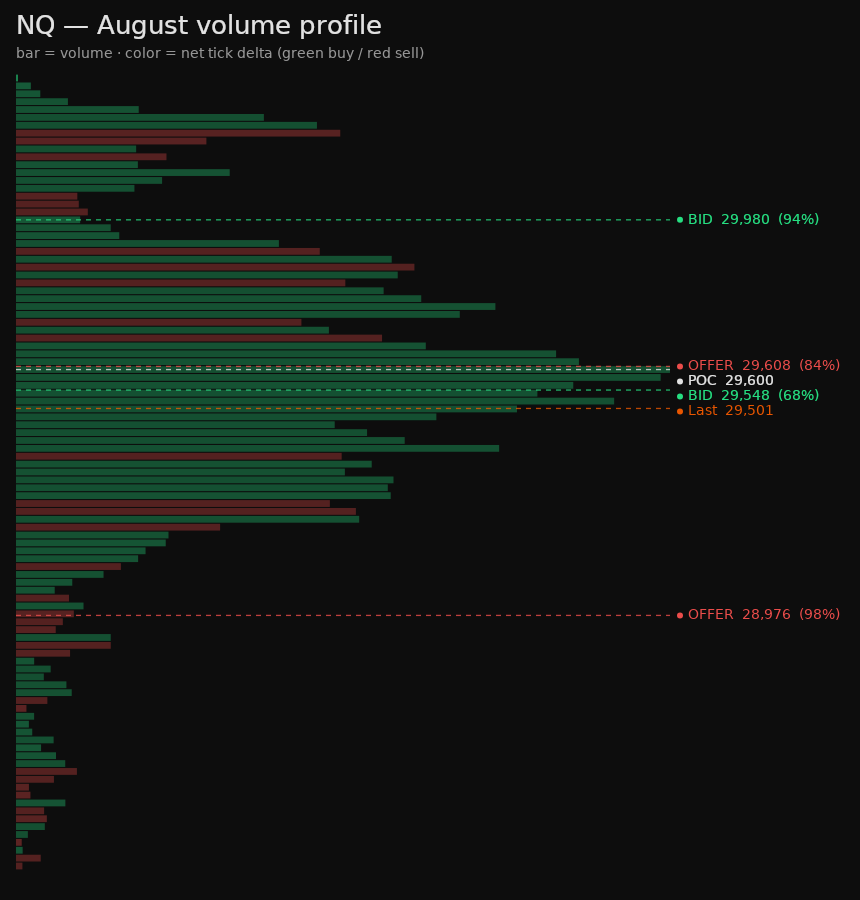
NQ's monthly volume profile shows a 2,029.5-point range from 28,313.5 to 30,343, with the point of control at 29,600, 77 points above Friday's close. The bulk of the month's volume traded in the upper half of that range, and the cumulative delta stayed positive throughout. That's not a market being distributed into; that's a market where buyers were consistently the aggressor, even on the down sessions.
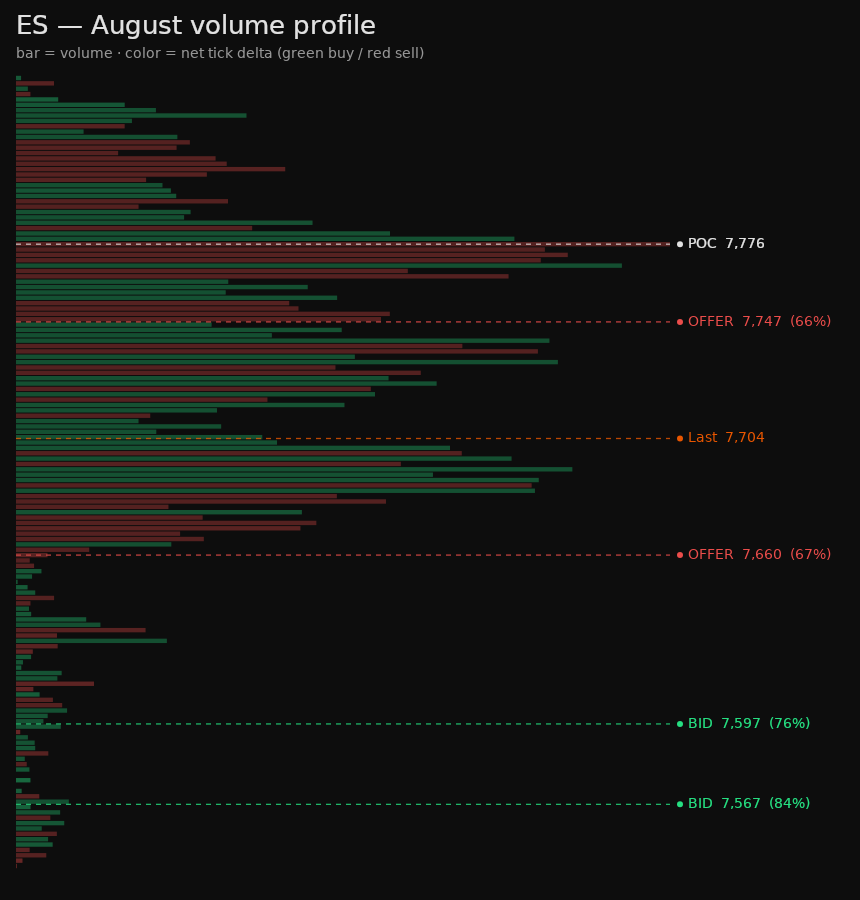
ES tells a different story. The monthly point of control sits at 7,776, 61 points above Friday's close, and the cumulative delta turned negative in the month's first week and never came back. The −8,337 it finished on is the least informative number in the sequence. The running total was −26,608 by the August 17 session and −26,038 again on August 24, and two sessions did the entire repair from there: August 27 at +8,935 and August 31 at +8,920, with the four sessions around them netting slightly negative. Some of that lean is structural, since down-moves trade aggressively while the slow grind higher trades passively. But a month that ran that deep for most of its length and closed near the middle of its price range is not a quiet month with a mild negative bias. Sellers did the work through the middle of August, and two sessions at the end did the repair. The month ended with buyers in NQ and the bid getting leaned on in ES, and that divergence is the context for everything that follows.
Last Week, Up Close
Monday, August 31 carried the lightest order flow of the week. NQ opened at 29,540, sold off to 29,273.5, and recovered to close at 29,521, down just 19 points on the day, with net delta of +215. The range was 272.75 points and the flow barely registered. ES was busier than it looked. It closed down 22.25 points at 7,701.25 on +8,920 delta, its largest positive print of the week, which means buyers were the aggressive side and price still finished lower.
Tuesday, September 1 was the real one, and it was ugly. NQ opened at 29,518.25, dropped to 29,002 intraday, and closed at 29,139, a 379.25-point decline on the session. The notable part: net delta printed +6,042. Buyers were lifting the offer the whole way down and price fell anyway. That is aggressive buying getting absorbed by resting supply, not accumulation. ES confirmed the damage more cleanly: −13,772 delta, its largest print of the week, with price closing down 53.75 at 7,647.5. ES was the honest session; NQ's positive delta on a down day is the anomaly worth watching.
Wednesday, September 2 was a near-flat grind. NQ tagged the week's low at 28,927.25 before recovering to close at 29,141, up just 4.5 points, on +3,006 delta. ES printed negative delta again at −13,405, closing up 24.25 at 7,669.25. Two sessions in a row with ES hitting the bid while price tried to stabilize.
Thursday, September 3 was the recovery session. NQ ran from 29,177 to close at 29,502.25, up 325.25 points, on +2,951 delta. ES added 75.75 points to close at 7,749.25, but net delta was −3,490, the third consecutive negative-delta session for ES, and price rose anyway. Buyers in NQ, sellers in ES, price up on both. That divergence was the tell.
Friday, September 4 was the session that reframes the whole week. NQ pushed to 29,704.5, the week's high, and then faded 181.5 points off that peak to close at 29,523, up just 18 points on the day. Net delta: −15,244. That is the week's largest print by a wide margin, and it came on the session where price was highest. Sellers were hitting the bid hard into that high. ES flipped positive on Friday at +8,272 and still closed down 34.75 at 7,715, which puts that buying on the same footing as NQ's Tuesday: aggressive, and absorbed rather than rewarded. Four sessions of positive delta on NQ, and then the biggest print of the week arrived negative, on the day price made its high. That's the week in one sentence.
Levels I'm Watching
Every level here comes from measured order flow: where executed buy volume and sell volume were genuinely one-sided at a specific price, not a line drawn by eye.
NQ conviction zones
| Zone | Price | Read |
|---|---|---|
| Re-offer | 29,507 (29,505–29,509) | Supply shelf — 81% conviction. |
| Re-offer | 29,065 (29,063–29,067) | Supply shelf — 93% conviction. |
| Re-offer (quarterly) | 28,960 (28,956–28,964) | Supply shelf — 74% conviction. |
| Bid (monthly) | 29,563 (29,563–29,564) | Demand cluster — 79% conviction. |
| Bid | 29,283 (29,282–29,284) | Demand cluster — 90% conviction. |
| Bid | 29,188 (29,185–29,192) | Demand cluster — 69% conviction. |
| Line in the sand | 28,927 | Last week's low — losing it is where I'd step back and reassess the bounce. |
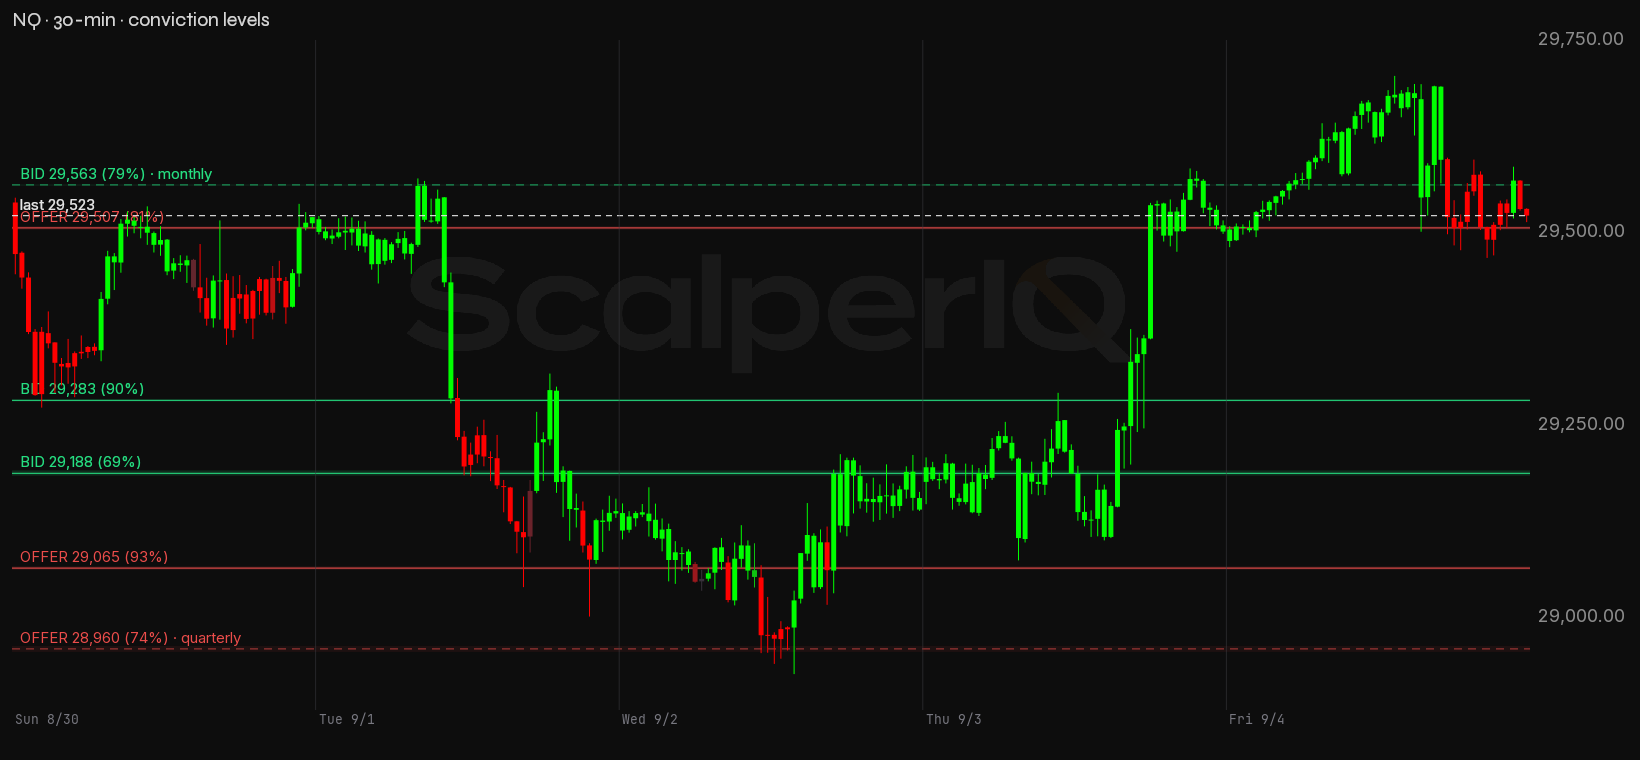
NQ has six levels mapped across the last quarter. Five sit below the close at 29,523; one sits above. The arrangement is inverted, and that is the part worth sitting with. The nearest thing overhead is the monthly bid shelf at 29,563, just 40 points above Friday's close, carrying 79% conviction*. That is demand sitting over price: a level where buyers were the one-sided side, standing where you would normally look for supply. The nearest level below is the mirror image, the weekly offer shelf at 29,507, just 16 points under the close at 81% conviction. Sellers owned that price, and it now sits where you would normally look for support. Demand overhead and supply underfoot is not the textbook arrangement, and it argues for holding both levels lightly rather than reading either one as a floor or a ceiling. The 29,283–29,284 weekly bid shelf at 90% conviction sits 240 points below, and the 29,065 weekly offer shelf at 93% conviction, the highest-conviction level in the NQ set, is 458 points down. The quarterly offer shelf at 28,956–28,964 sits 563 points below the close at 74% conviction.
The structure here is tight: NQ is sandwiched between the 29,507 weekly shelf 16 points below and the 29,563 monthly shelf 40 points above. That's a 56-point corridor, and Friday closed inside it at 29,523 after trading as high as 29,704.5. The week's heaviest sell print landed on the session that made the high, not on the session that made the low.
ES conviction zones
| Zone | Price | Read |
|---|---|---|
| Re-offer (quarterly) | 7,747 (7,747–7,748) | Supply shelf — 51% conviction. |
| Re-offer | 7,697 (7,697–7,698) | Supply shelf — 74% conviction. |
| Re-offer | 7,658 (7,658–7,659) | Supply shelf — 86% conviction. |
| Bid | 7,723 (7,723–7,724) | Demand cluster — 61% conviction. |
| Bid | 7,656 (7,656–7,657) | Demand cluster — 84% conviction. |
| Bid (quarterly) | 7,630 (7,630–7,631) | Demand cluster — 74% conviction. |
| Line in the sand | 7,618 | Last week's low — losing it is where I'd step back and reassess the bounce. |
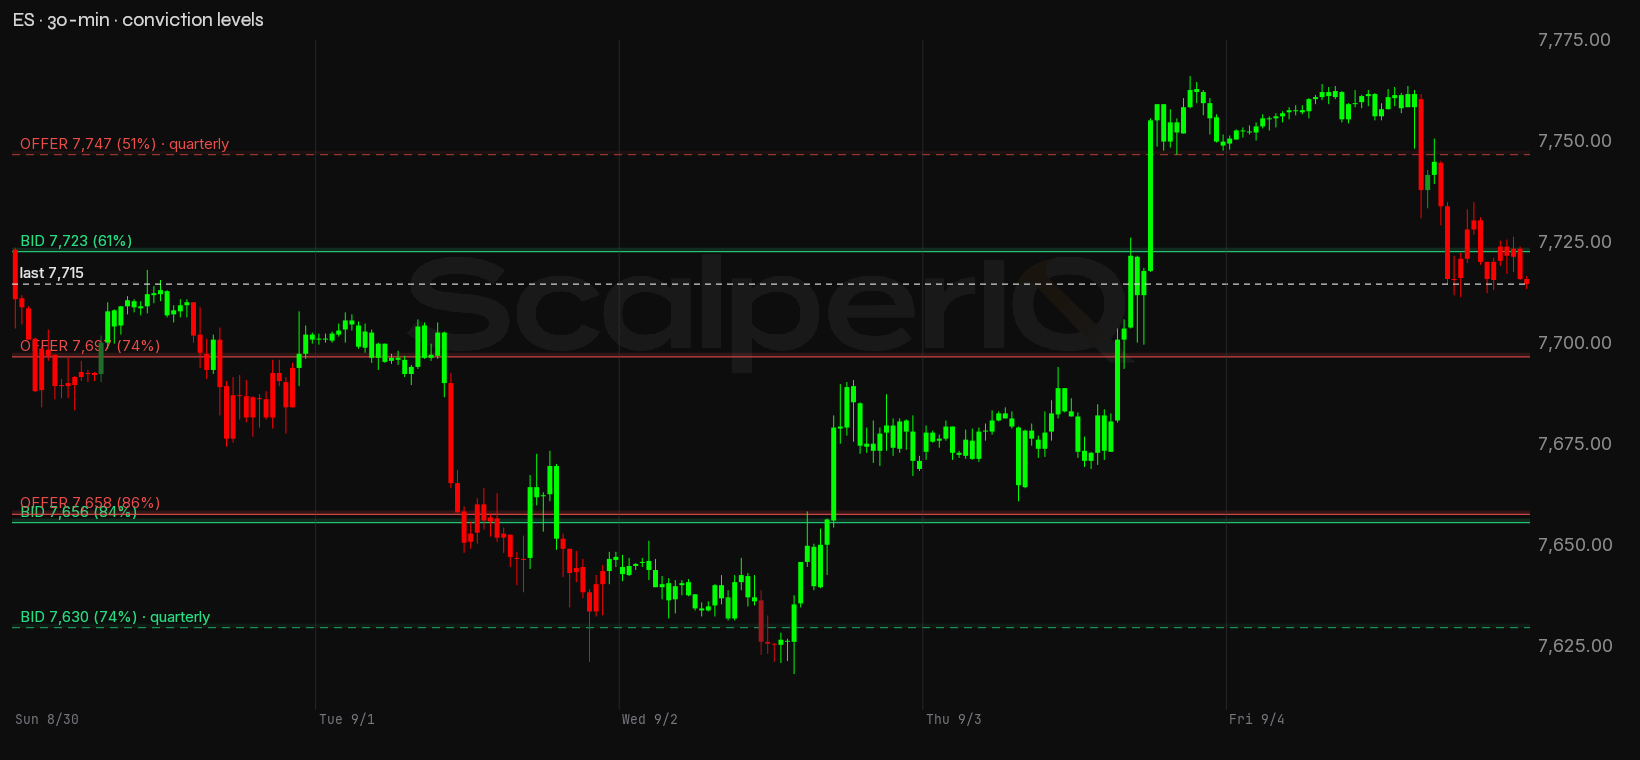
ES has six levels mapped, with four below the close at 7,715 and two above, and it is arranged exactly the way NQ is. The nearest level overhead is a bid shelf at 7,723, just 8 points above Friday's close, at 61% conviction. The nearest level below is an offer shelf at 7,697, 18 points down at 74% conviction. Demand above, supply below, on both instruments. Beyond the 7,723 bid, the quarterly offer shelf at 7,747–7,748 sits 32 points up at 51% conviction, the thinnest agreement in the ES set. Below the 7,697 offer, the 7,656 weekly bid shelf at 84% conviction sits 59 points down, and the 7,658 weekly offer shelf at 86% conviction is right beside it at 57 points below. The quarterly bid shelf at 7,630 is 85 points below the close at 74% conviction.
That leaves ES inside a 26-point band, closing Friday at 7,715. Three consecutive sessions of negative delta into Thursday's high at 7,766.5, and then Friday's +8,272 couldn't hold the gains, closing at 7,715 after tagging 7,764.5.
The thing that would confirm or break this read: NQ holding above the 29,507 weekly shelf on the first meaningful test next week, with sell delta drying up on the approach rather than accelerating through it.
On the Calendar
The week opens short. Monday is Labor Day and the CME closes at 12:00 CT, so the first session is a half day on holiday flow. Treat any level test on Monday as provisional. Three releases follow, all of them in the same 8:30 AM ET slot, all of them stacked into the back half of the week.
- Thursday, September 10 — PPI (Aug 2026 data), 8:30 AM ET. This month the producer-side number lands the day before CPI rather than after it, so it sets the tone going into Friday instead of confirming what CPI already said.
- Thursday, September 10 — Initial Jobless Claims, 8:30 AM ET. Same slot as PPI. Two releases into one 8:30 window is what makes Thursday the harder of the two sessions to read while it is happening.
- Friday, September 11 — CPI (Aug 2026 data), 8:30 AM ET. The week's main event, and it lands on the last session. Whatever the number does to positioning has to resolve into the weekend rather than over three more sessions.
Bottom Line
NQ closed the week up 13.5 points and ES closed down 9.75, but the week's real story is Friday's −15,244 delta on NQ printing into the weekly high. Four sessions of buyers lifting the offer, and then the largest print of the week arrived on the sell side at the top. The bias is neutral going into the Week of September 7, 2026, with NQ sandwiched in a 56-point corridor between the 29,507 weekly shelf and the 29,563 monthly shelf. ES is similarly compressed between 7,697 and 7,723. NQ leads if buyers clear 29,563 on positive delta; ES's three-session negative-delta streak into Thursday's high is the tell that the recovery hasn't earned full trust yet. Lose 29,507 on NQ with sell delta expanding and the question becomes whether Wednesday's low at 28,927.25 is the next reference point.
* Conviction % — how one-sided the order flow was at that price. 100% means it traded essentially one direction; 50% means buyers and sellers fought it to a draw. It's a read on agreement, not size — a decisive level can still be a thin one.
* Delta means raw tick delta — executed buy volume minus sell volume, straight off the tape.
* NQ / ES are the full-size E-mini Nasdaq-100 and S&P 500 futures. We read the full-size contracts because that's where the institutional order flow trades; the delta and volume figures here are full-size contract counts. If you trade the micros (MNQ / MES), the price levels map across one-for-one — they track the same index.
Delta Reads are my own read of the order flow — informational only, not financial advice and not a recommendation to buy or sell anything. Trading futures is not suitable for all persons: it carries a substantial risk of loss, and you can lose more than your initial investment. This is my interpretation of the data and it can contain errors — in the data, in the analysis, or both. Do your own due diligence and trade your own plan.

Get the Delta Reads
Our weekly order-flow read on MES and MNQ — what the tape did, and the levels we're watching next. One email a week. No noise.
See what ScalperIQ looks like on a live chart.
Try Free for 14 DaysNo credit card required in the US (outside the US, a card is required to start). Available on MotiveWave, EdgeProX, and NinjaTrader.