
Delta Read · Week of August 17, 2026 — 780 Points Down, the Bid Shelf Is 34 Points Away
Get the Delta Reads
Our weekly order-flow read on MES and MNQ — what the tape did, and the levels we're watching next. One email a week. No noise.
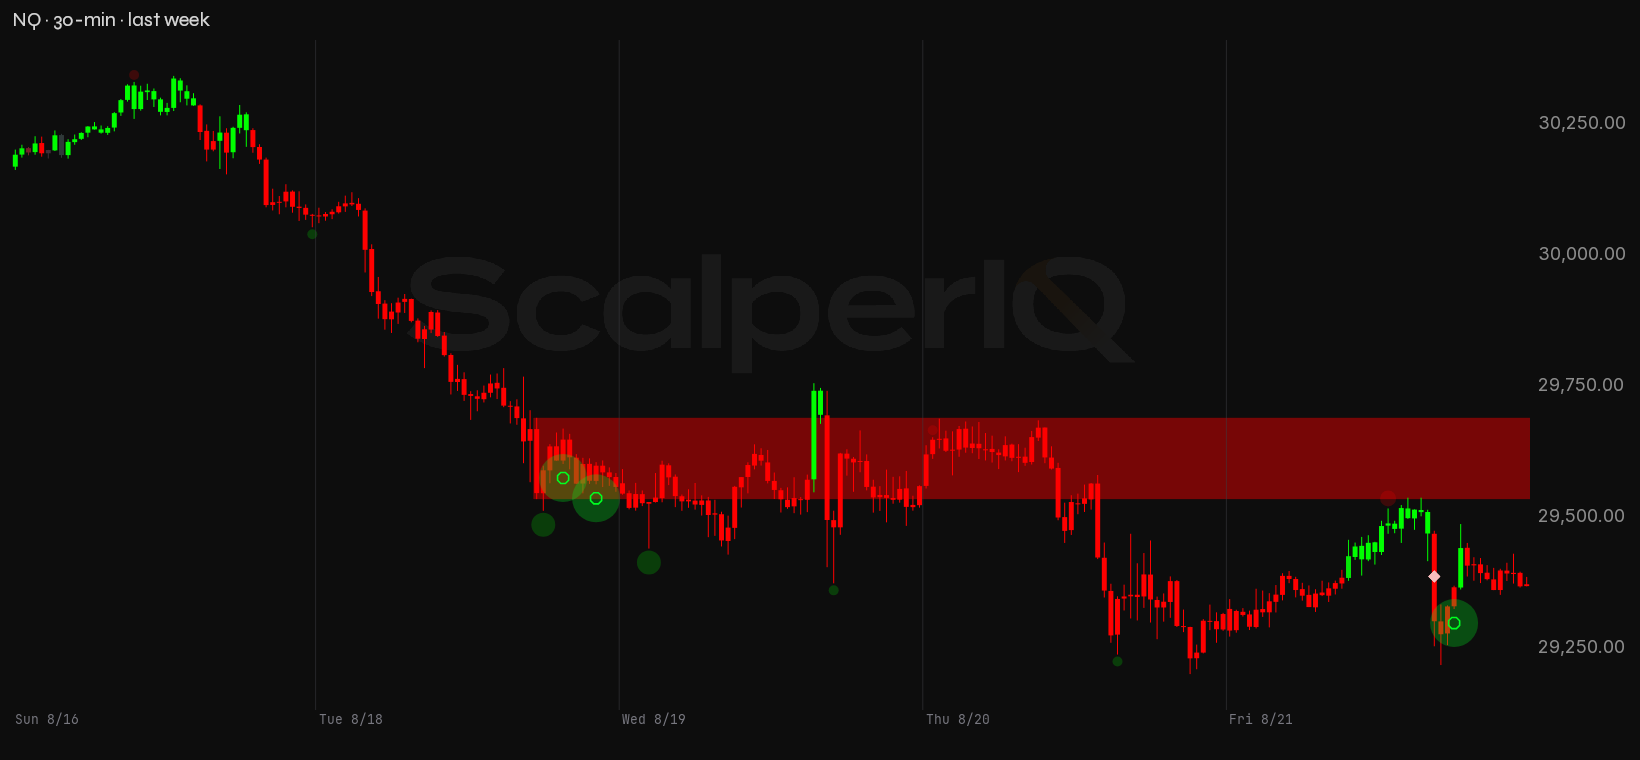
Last week's forward watch was precise: NQ closing a full session above the 30,194 bid shelf with net delta positive — buyers lifting the offer through that level, not price tagging it on fading sell flow. It never happened. NQ opened the week at 30,170, tagged 30,343 on Monday, and then spent the next four sessions working lower. Price did clear 30,194 intraday on that Monday push — what never came was a full session closing above it. Both lines in the sand lost — NQ's at 29,533.5 and ES's at 7,738.75 — and price finished the week below every level in last week's set. The bias resolved mixed on both instruments: the delta direction held positive, but price gave back 780 points on NQ and 114.75 on ES.
Here's the week on a 30-minute chart with the order flow marked up. The story is a market that opened near the highs, distributed quietly on Monday, then accelerated lower mid-week before buyers showed up in size on Wednesday and Friday — but never enough to recover the ground lost.
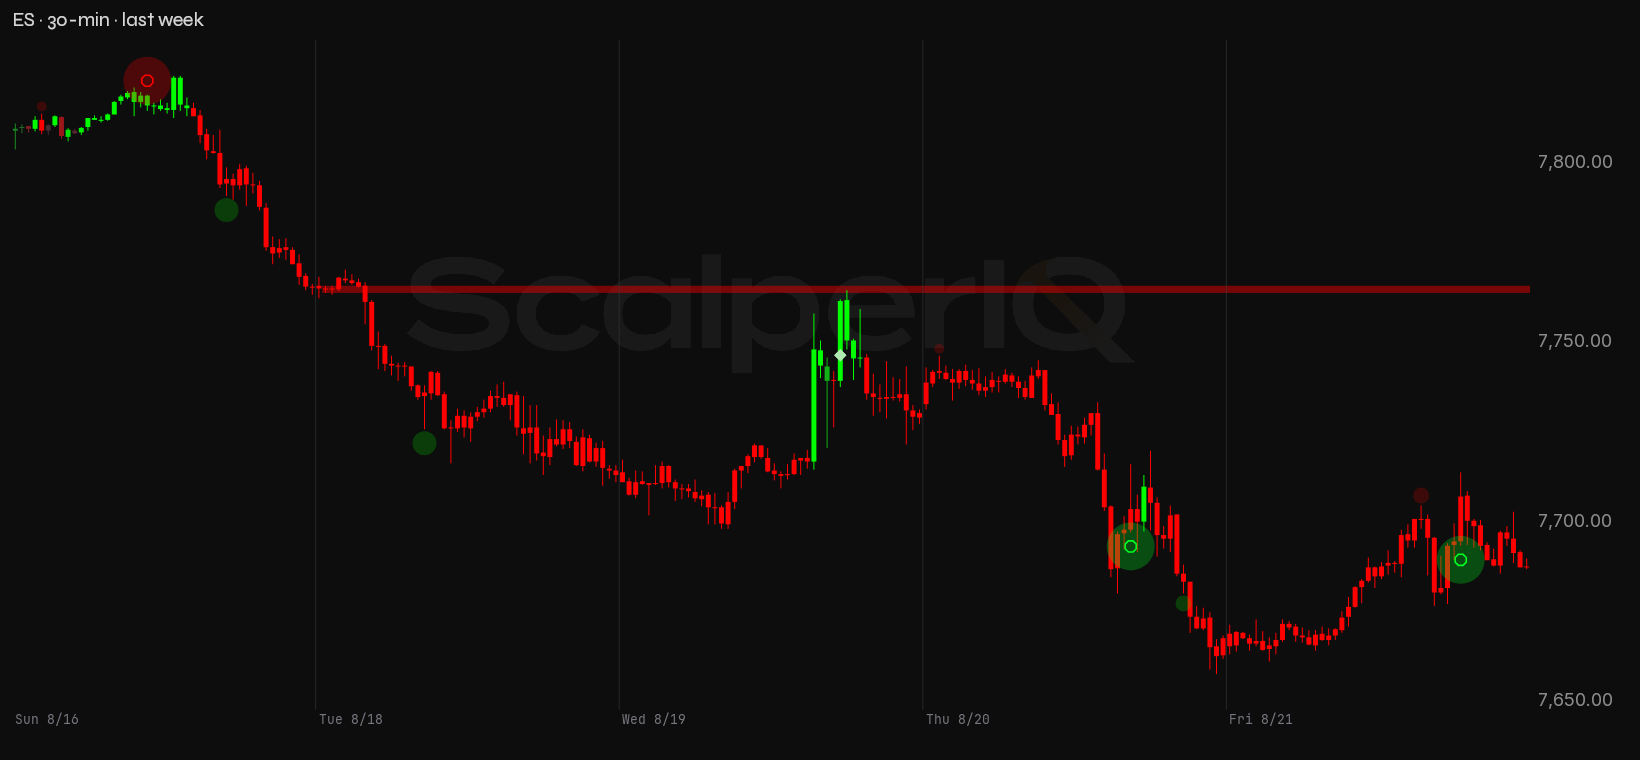
ES tells a related but distinct story. NQ closed down 780 points from the prior week's 30,154 close; ES gave back 114.75 from 7,802.5. The divergence in magnitude is worth noting — NQ led the selling and NQ led the partial recovery. Quick version: the bias is neutral, and the one thing that matters most is whether the 29,408 bid shelf 34 points above NQ's close holds as support or flips to resistance.
August's Delta Is Running Two Different Stories Depending on Which Instrument You're Reading
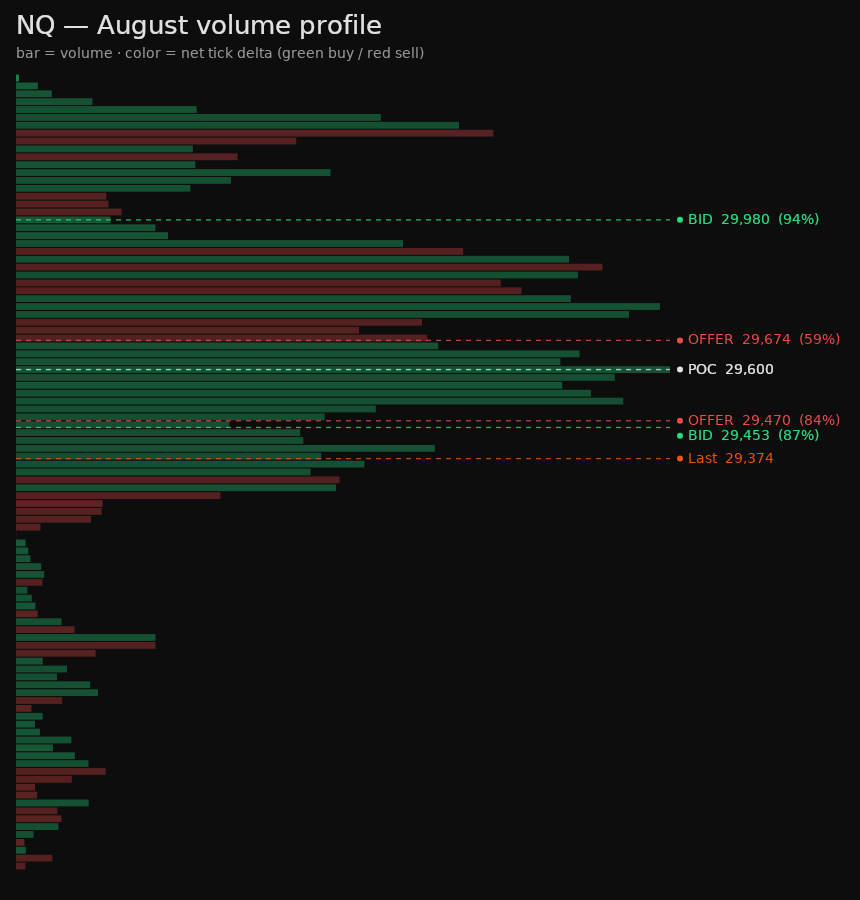
Month-to-date, NQ has accumulated +43,864 net delta while price has pulled back from the August high of 30,343 to close the week at 29,374. That's a meaningful divergence — buyers have been lifting the offer on balance all month, but price is sitting 969 points off the August peak. The cumulative buying is real, but it hasn't been enough to hold the highs.
ES is running the opposite character. Month-to-date cumulative delta sits at −17,225 — sellers leaning on the bid — while price has traded in a 295.75-point range between 7,542.75 and 7,838.5. The negative cumulative on ES isn't alarming on its own; down-moves trade more aggressively than the quiet buying that floats price higher, so some structural negative lean is normal. But the gap between NQ's +43,864 and ES's −17,225 on a month where both instruments are net lower is the divergence worth watching. NQ's buyers have been more active; ES's sellers have been more aggressive.
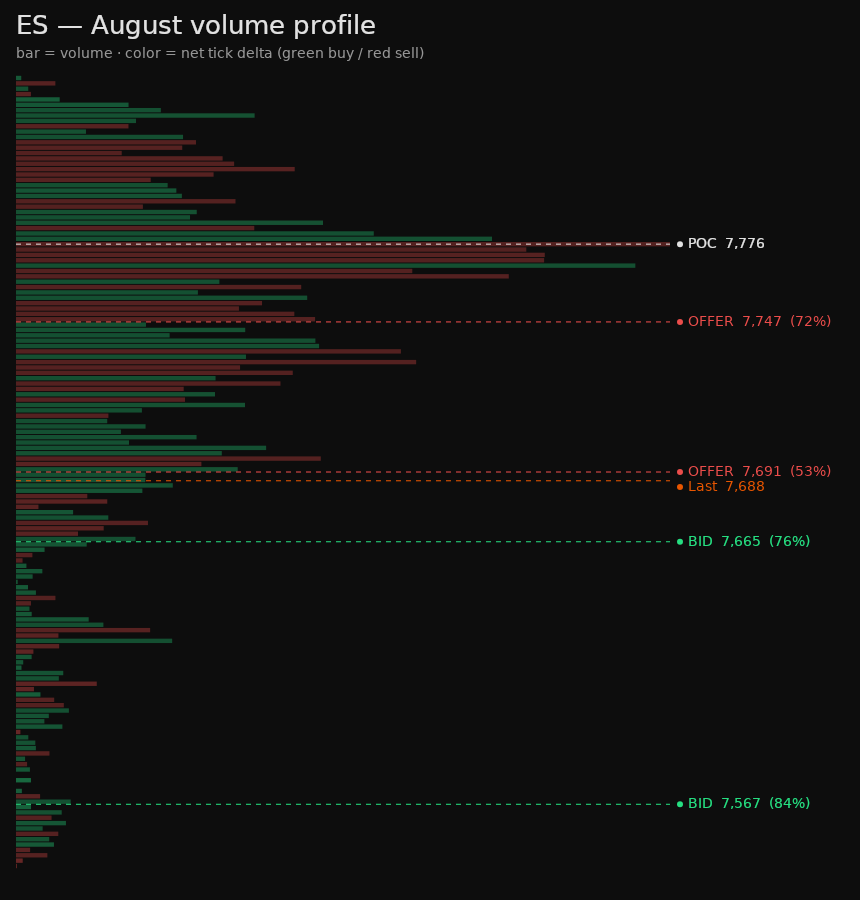
What this month has been doing, in plain terms: NQ has had genuine buying interest on dips, and that buying has kept the cumulative positive even as price failed to hold the highs. ES has had the opposite — sellers pressing on rallies, keeping the cumulative red. Neither instrument has resolved cleanly into distribution or accumulation. The monthly bias on both reads neutral, and that's the honest answer — this is a market in the middle of figuring out which side owns it.
Last Week, Up Close
Monday, August 17 was the tell. NQ opened at 30,170, tagged the week's high of 30,343, and then faded 264.75 points off that high to close at 30,078.25 — down 91.75 on the session with −766 net delta. The negative delta on a session that opened near the highs and printed a new weekly high is the distribution signature: sellers were leaning on the bid into strength. ES confirmed it — Monday was the only negative-delta session of the week for ES, printing −1,720 as price faded 59 points off the 7,824.5 high to close at 7,765.5.
Tuesday, August 18 was the real damage. NQ dropped 517.5 points on the session, closing at 29,559.5 after opening at 30,077. The interesting part: net delta on Tuesday was +4,199. Price fell hard, but buyers were lifting the offer on the way down — absorption, not capitulation. ES echoed the price decline, closing at 7,713.25 (down 52.75), but its Tuesday delta was only +677, the smallest positive print of the week.
Wednesday, August 19 was NQ's strongest order-flow session of the week. NQ printed +8,843 net delta — the week's largest — while closing nearly flat at 29,561, down just 5.5 points on the session. That's buyers absorbing the Tuesday damage and holding the level. ES printed +2,440 on Wednesday and actually closed up 16.5 points to 7,730.5. The buying was real on Wednesday; it just didn't have enough behind it to push price back toward the highs.
Thursday, August 20 gave back the Wednesday progress. NQ dropped 244.25 points to 29,317.25 on −1,056 delta — sellers back on the bid. ES fell 65.25 points to 7,667.75, but here's where the two instruments split: ES's Thursday delta was +2,400. Price down, delta positive on ES — the same absorption pattern that showed up on Tuesday in NQ. Sellers were moving price lower in ES, but buyers were meeting them.
Friday, August 21 closed both instruments slightly higher. NQ added 47 points to 29,374 on +710 delta — the week's smallest positive print, barely a rounding error on a 319-point range session. ES gained 18.75 points to 7,687.75 on +3,866 delta — Friday was actually ES's largest delta session of the week. The week ended with buyers present but not pressing.
NQ closed two sessions negative (Monday and Thursday); ES closed one (Monday only). NQ's week net delta was +11,930; ES's was +7,663. Both positive, both lower in price.
Levels I'm Watching
These come from our conviction* zones — persistent order flow at specific prices, not lines drawn freehand. The chart marks current price with a dashed line and shows broader-window levels alongside the weekly ones.
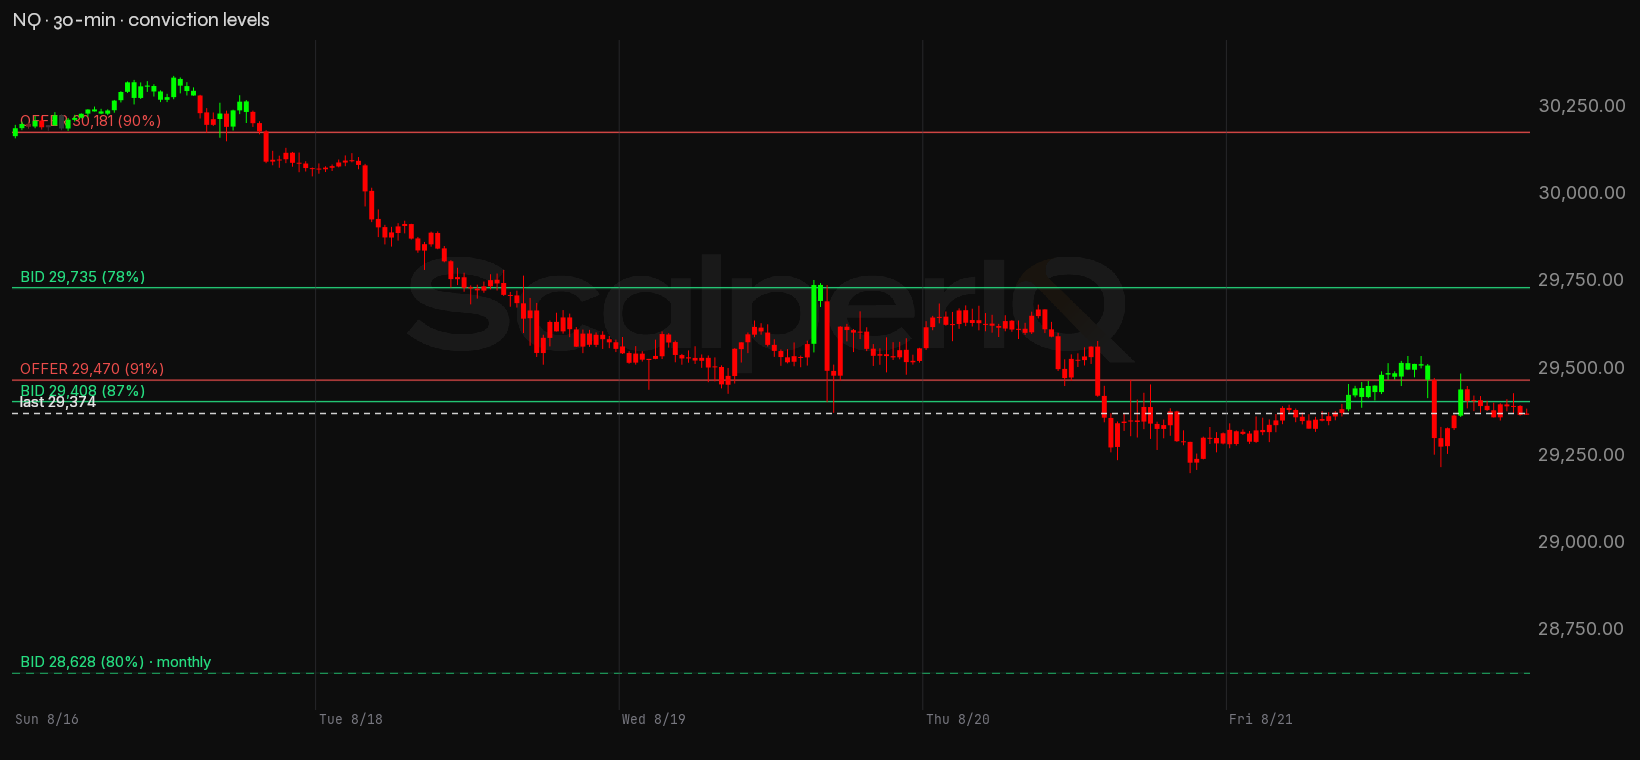
NQ conviction zones
| Zone | Price | Read |
|---|---|---|
| Re-offer | 30,181 (30,177–30,185) | Supply shelf — 90% conviction. |
| Re-offer | 29,470 (29,469–29,472) | Supply shelf — 91% conviction. |
| Bid | 29,735 (29,730–29,738) | Demand cluster — 78% conviction. |
| Bid | 29,408 (29,406–29,412) | Demand cluster — 87% conviction. |
| Bid (monthly) | 28,628 (28,626–28,632) | Demand cluster — 80% conviction. |
| Line in the sand | 29,203 | Last week's low — losing it is where I'd step back and reassess the bounce. |
NQ has four levels above the close and one below. The first thing price runs into overhead is the weekly bid shelf at 29,408 — 87% conviction, just 34 points above Friday's close of 29,374. That's not a level you approach gradually; price is already sitting in its shadow. Above that, the weekly offer shelf at 29,470 is 96 points up (91% conviction), and the 29,735–29,738 weekly bid shelf is 361 points up (78% conviction). The 30,181 offer shelf is 807 points above the close, 90% conviction — price cleared it on Monday's push to 30,343 and then lost it, which is why it sits overhead again. The one level below is the monthly bid shelf at 28,628, 746 points down, carrying 80% conviction. That's a long way down, and it's the nearest mapped support in the trailing quarter.
The structure here is tight overhead and distant support. The 29,408 shelf is so close to current price that the open Monday morning will tell you immediately whether it's acting as a magnet or a wall. If buyers are lifting the offer through 29,408 with positive delta, the next test is the 29,470 offer shelf 62 points higher. If price stalls at 29,408 and delta turns negative, that shelf is confirming itself as resistance and the 28,628 monthly bid is the next meaningful floor — 746 points lower.
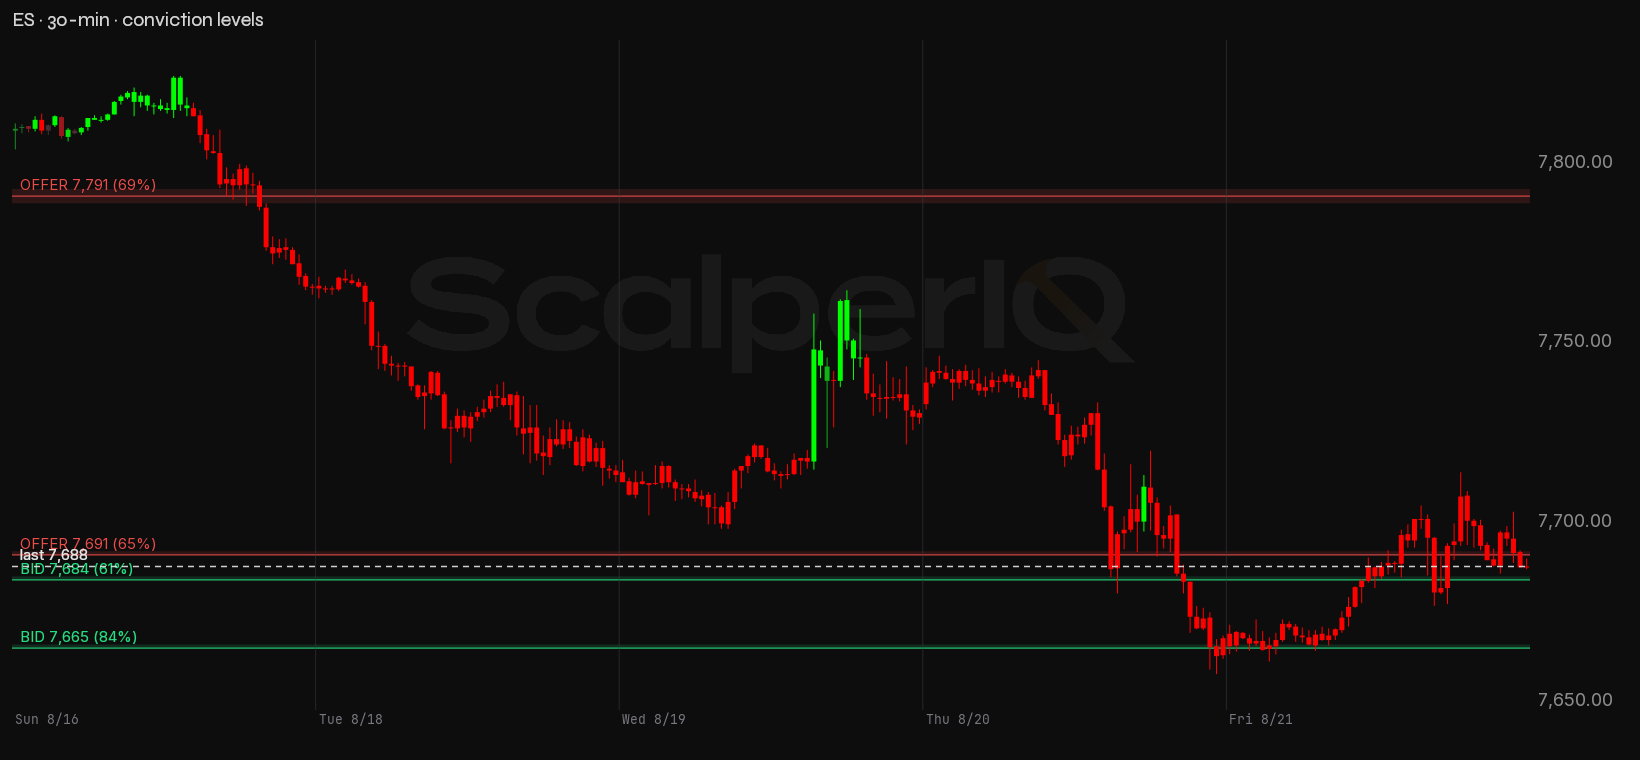
ES conviction zones
| Zone | Price | Read |
|---|---|---|
| Re-offer | 7,791 (7,789–7,793) | Supply shelf — 69% conviction. |
| Re-offer | 7,691 (7,691–7,692) | Supply shelf — 65% conviction. |
| Bid | 7,684 (7,684–7,685) | Demand cluster — 61% conviction. |
| Bid | 7,665 (7,665–7,666) | Demand cluster — 84% conviction. |
| Line in the sand | 7,658 | Last week's low — losing it is where I'd step back and reassess the bounce. |
ES has two levels above the close and two below — a much tighter cluster. The nearest overhead is the weekly offer shelf at 7,691, just 3 points above Friday's close of 7,687.75 (65% conviction). Below the close, the weekly bid shelf at 7,684 is 4 points down (61% conviction), and the weekly bid shelf at 7,665 is 23 points down (84% conviction). The 7,791 offer shelf is 103 points above (69% conviction).
ES is essentially sitting in the middle of a 7-point sandwich — 7,684 bid below, 7,691 offer above. That's not a range; that's a decision point. The 7,665 bid shelf 23 points down is the real support if 7,684 gives way, and it carries the higher conviction of the two (84% vs. 61%). Above, the 7,791 offer shelf is the next meaningful resistance after 7,691.
The one thing I need to see this week: NQ closing a full session above 29,408 with net delta positive — buyers lifting the offer through that shelf, not price drifting up on thin flow.
On the Calendar
The scheduled risk worth timing around this week:
- Wednesday, August 26 — GDP (Second Estimate, Q2 2026), 8:30 AM ET. The GDP print tends to gap the tape and whipsaw order flow for the first 5–10 minutes before delta settles into a direction. With NQ sitting 34 points below a key shelf, a gap through 29,408 on the number is possible — but the first spike is usually noise.
- Thursday, August 27 — Initial Jobless Claims, 8:30 AM ET. Lower-impact most weeks, but an elevated reading can stir near-term volatility around the number. Worth noting that both events this week print at 8:30 AM ET.
Bottom Line
The week ended with NQ down 780 points and ES down 114.75, both on positive net delta — buyers absorbed the selling but couldn't hold the highs. The bias is neutral. NQ is 34 points below the 29,408 weekly bid shelf, which is now the pivot: reclaim it on positive delta and the 29,470 offer shelf becomes the next test; fail to hold it and the nearest mapped support is 746 points lower at the monthly 28,628 bid. ES is in a 7-point decision zone between the 7,684 bid and the 7,691 offer — whichever side breaks first with conviction tells you which instrument is leading. NQ leads if the thesis works; ES's tight cluster is the tell if it fails.
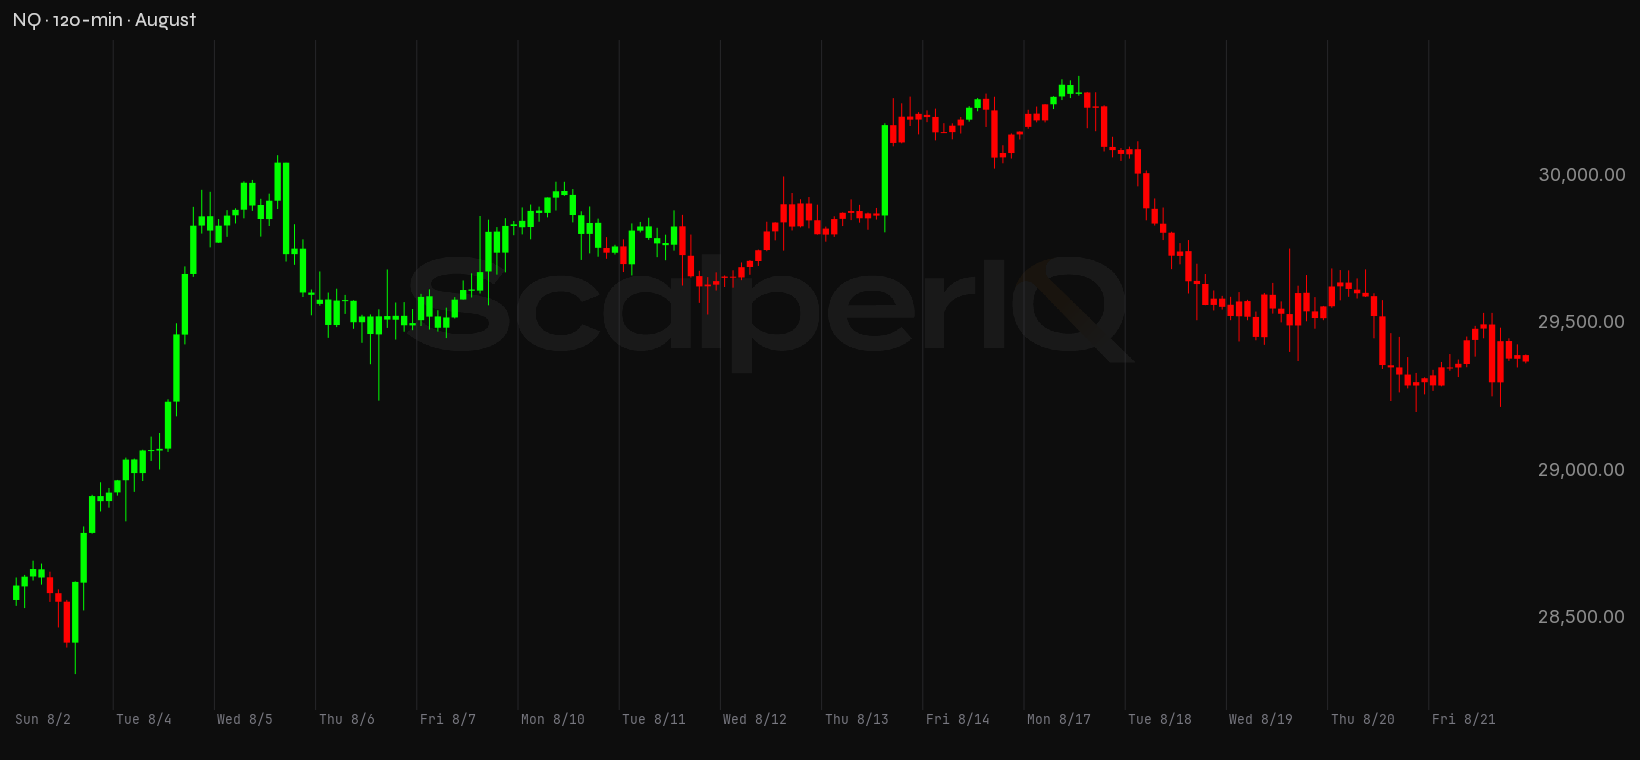
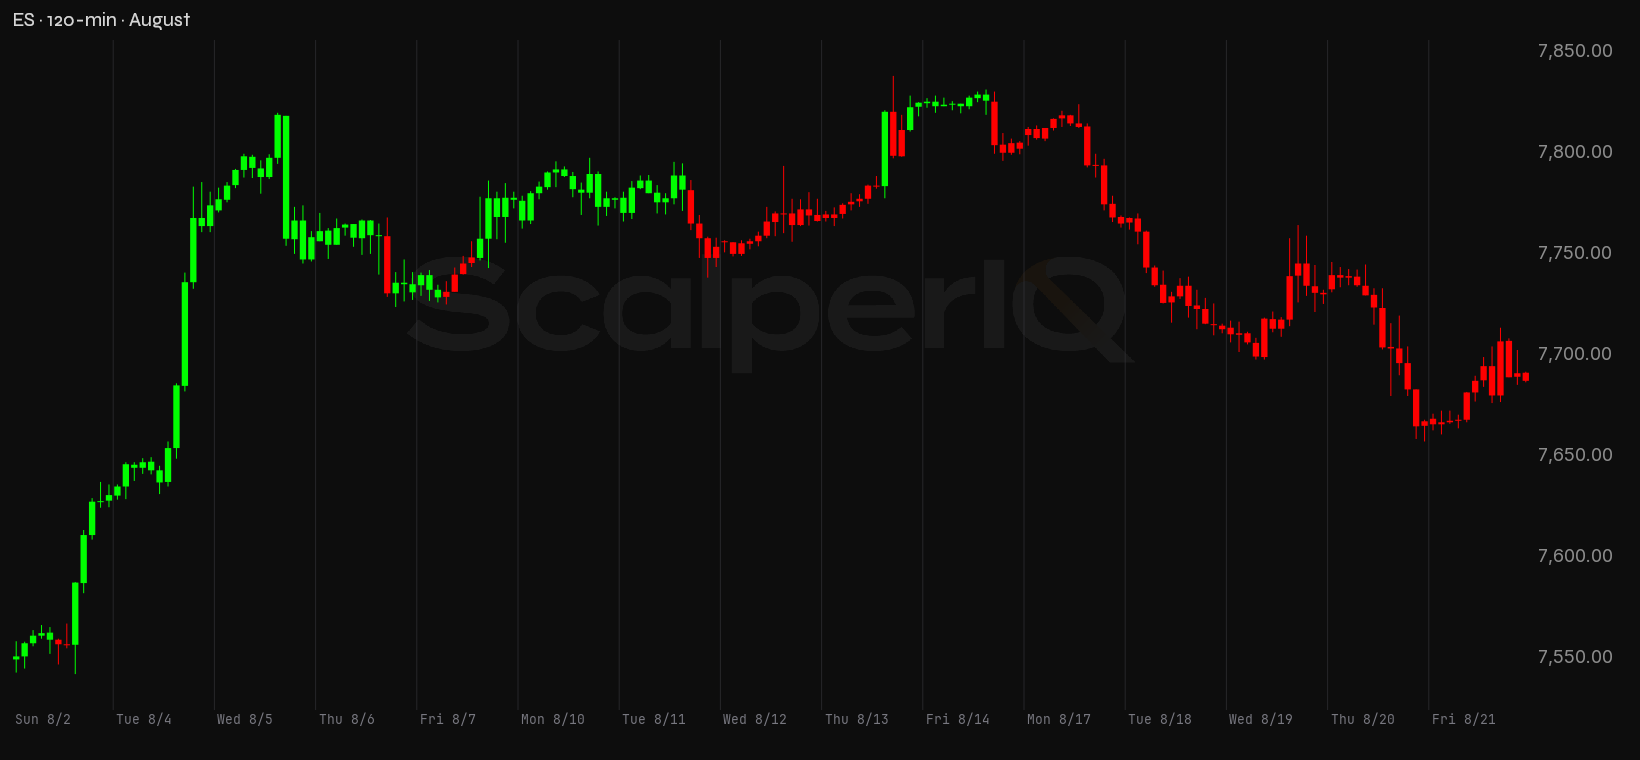
* Conviction % — how one-sided the order flow was at that price. 100% means it traded essentially one direction; 50% means buyers and sellers fought it to a draw. It's a read on agreement, not size — a decisive level can still be a thin one.
* Delta means raw tick delta — executed buy volume minus sell volume, straight off the tape.
* NQ / ES are the full-size E-mini Nasdaq-100 and S&P 500 futures. We read the full-size contracts because that's where the institutional order flow trades; the delta and volume figures here are full-size contract counts. If you trade the micros (MNQ / MES), the price levels map across one-for-one — they track the same index.
Delta Reads are my own read of the order flow — informational only, not financial advice and not a recommendation to buy or sell anything. Trading futures is not suitable for all persons: it carries a substantial risk of loss, and you can lose more than your initial investment. This is my interpretation of the data and it can contain errors — in the data, in the analysis, or both. Do your own due diligence and trade your own plan.

Get the Delta Reads
Our weekly order-flow read on MES and MNQ — what the tape did, and the levels we're watching next. One email a week. No noise.
See what ScalperIQ looks like on a live chart.
Try Free for 14 DaysNo credit card required in the US (outside the US, a card is required to start). Available on MotiveWave, EdgeProX, and NinjaTrader.