
Delta Read · Week of August 3, 2026 — Monday Bought It, the Rest of the Week Questioned It
Get the Delta Reads
Our weekly order-flow read on MES and MNQ — what the tape did, and the levels we're watching next. One email a week. No noise.
Last week's forward watch was a specific ask: a full session on MNQ closing above the monthly 28,435 offer shelf with net delta positive — buyers lifting the offer through the level, not price floating on whatever residual flow was left in the book. It triggered on day one: Monday closed at 28,929.25 on +15,021 delta, and Tuesday drove it home with +35,926, the week's biggest print. Friday's close at 29,841.0 looked like more of the same. It wasn't. Friday's net delta on MNQ was +492 — barely a rounding error on a 412-point range session. The prior offer shelves broke cleanly to the upside on both instruments, and both lines in the sand held. The bias resolved mixed on MNQ and MES alike: price went hard, but the order flow behind the back half of the week stayed complicated. That's the thread we're picking up.
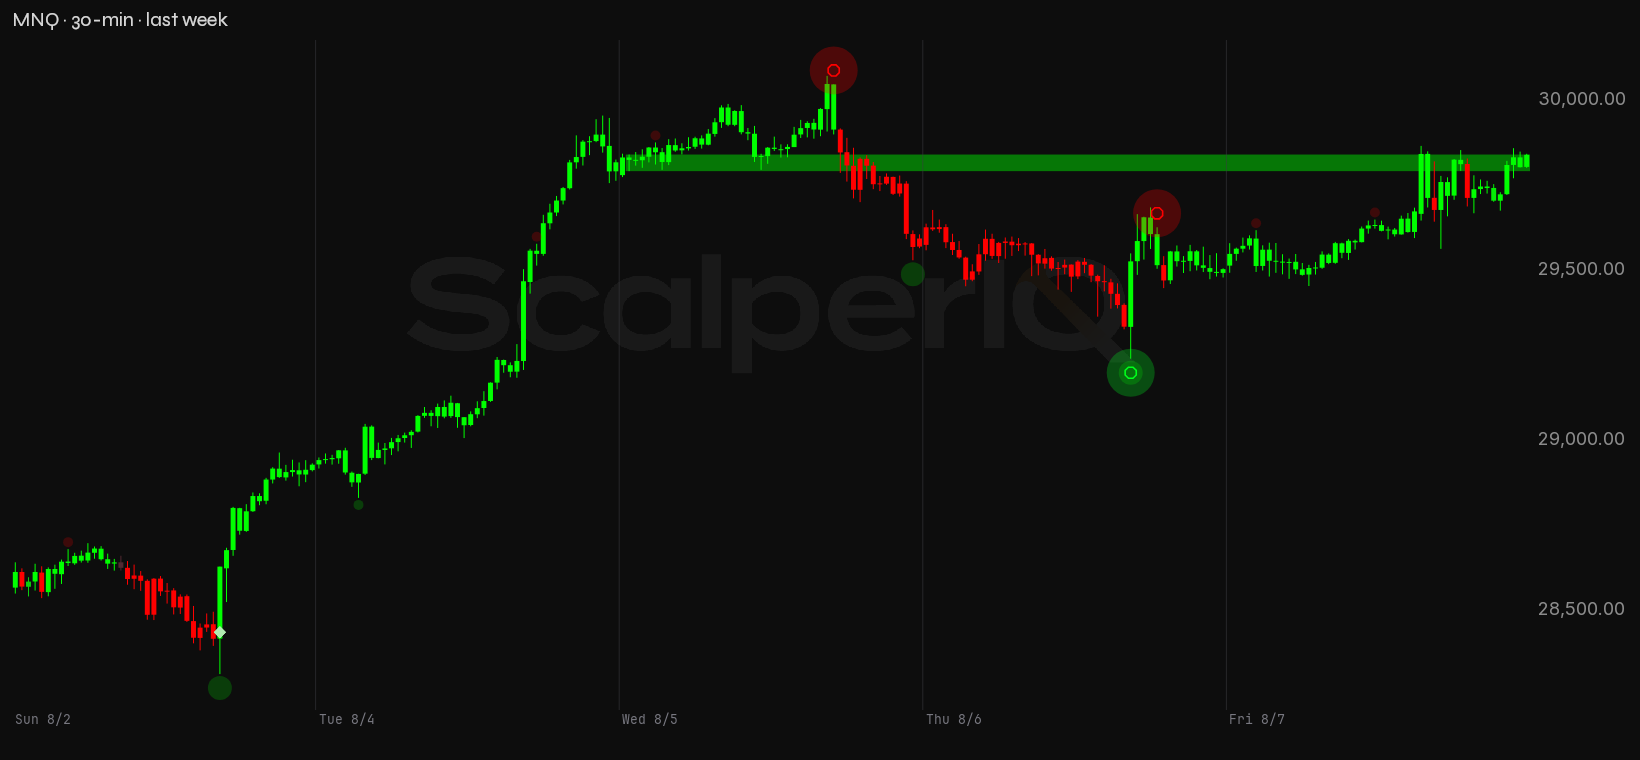
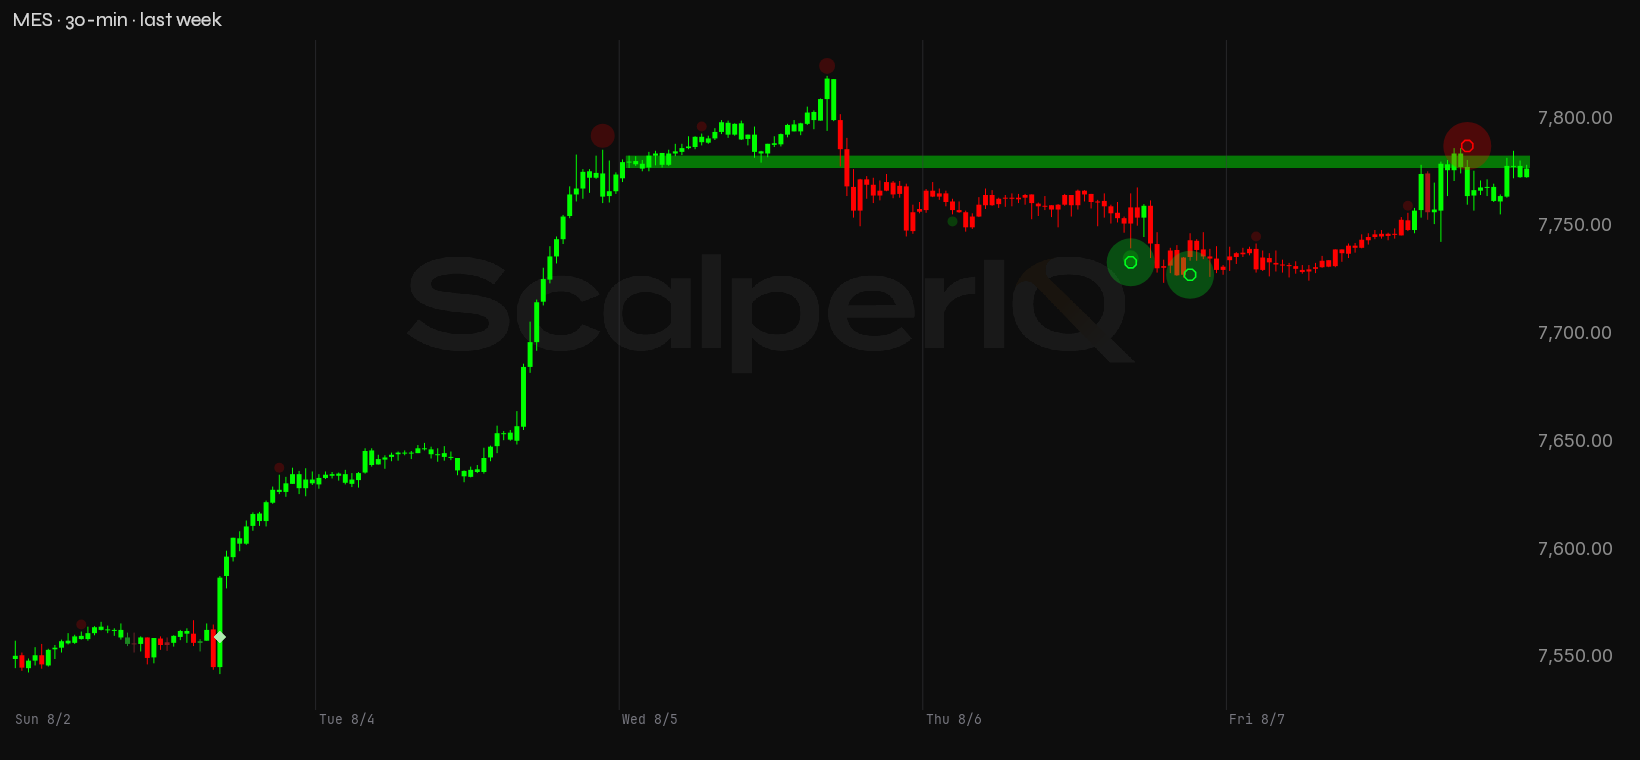
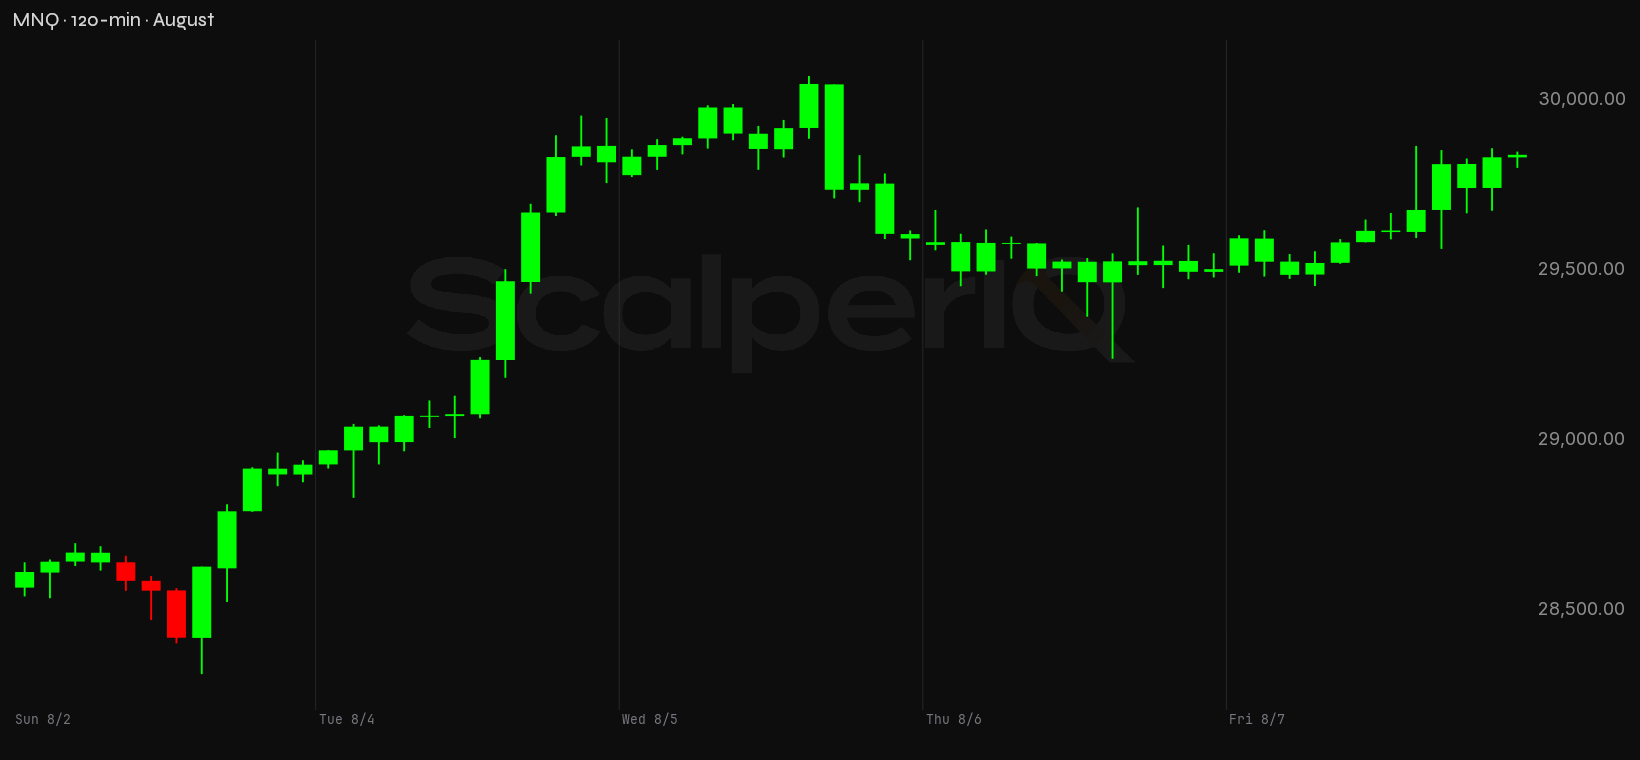
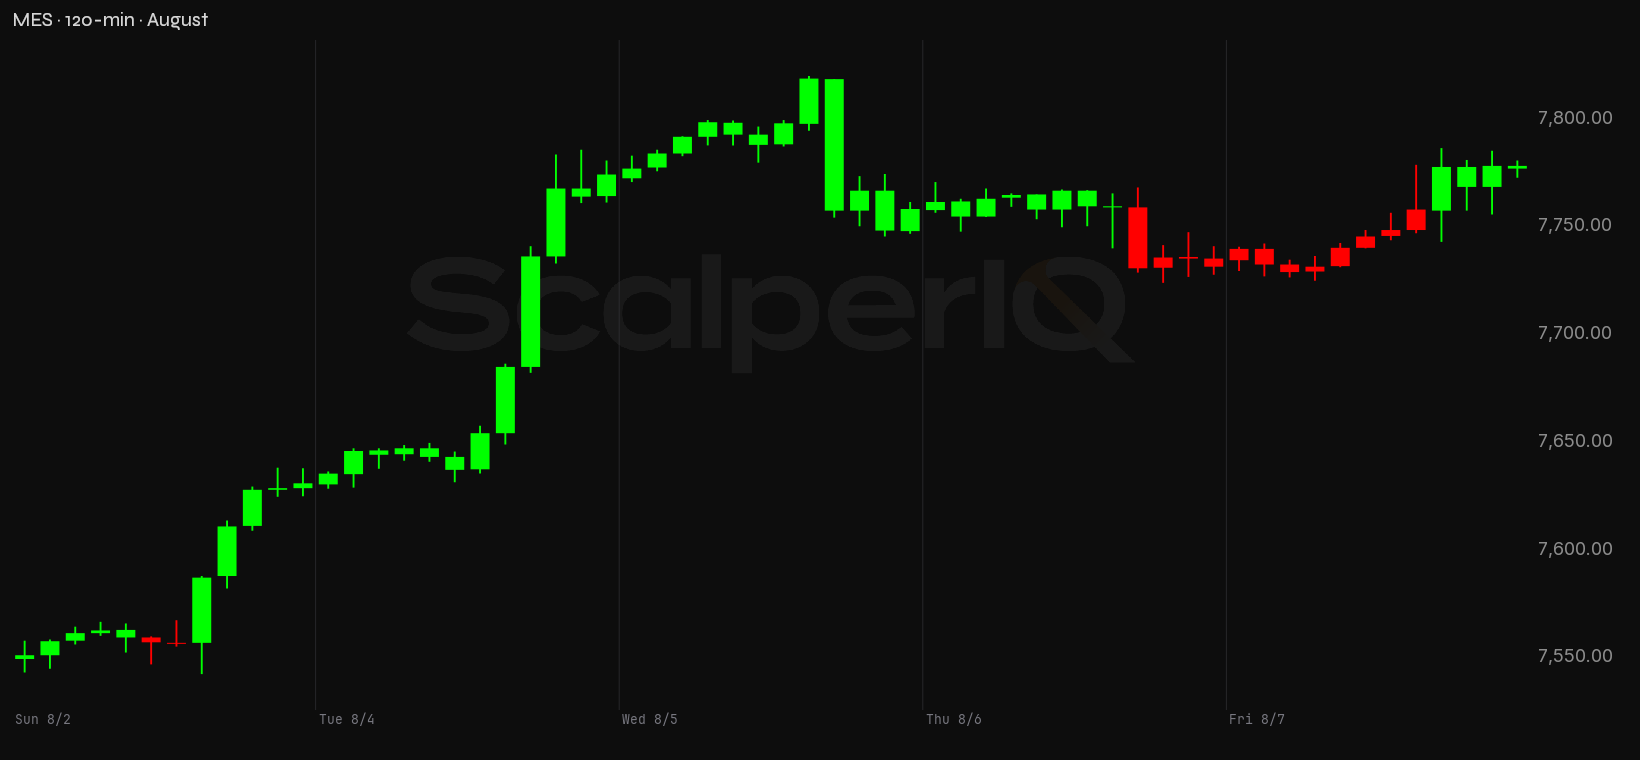
MNQ closed the week at 29,841.0, up 1,557 points from the prior Friday's close of 28,284.0. MES closed at 7,777.25, up 274.75 points from 7,502.5. Both instruments tagged their weekly highs mid-week and spent Thursday and Friday giving some of it back. Here's the full week on the 30-minute chart:
Quick version: the move is real on price, unconfirmed on delta, and the 29,929 offer shelf is the first thing MNQ runs into from here.
August Opened With a Bang and Then Stalled
August is only one week old, so the monthly picture and the weekly picture are the same picture — but the character of that picture is worth naming clearly. MNQ's cumulative delta for the month sits at +12,952 on a 1,760-point range. MES is at +6,081 on a 277.5-point range. Both read neutral on bias. The raw numbers look positive, but the distribution of that delta across sessions tells a different story.
On MNQ, three of five sessions closed with positive delta and two closed negative. But the weight is lopsided: Monday and Tuesday together printed +50,947 delta between them. Wednesday through Friday combined for −37,995. The month's net positive number is entirely a function of those first two sessions — everything since has been the tape leaning on the bid while price held near the highs. That's not distribution in the classic sense, but it's not accumulation either. It's a market that ran hard and then went quiet in a way that hasn't resolved.
MES tells a similar story with different proportions. Two positive sessions early — Monday at +14,174 and Tuesday at +16,433 — and three negative ones after. The last three sessions of the week on MES closed with negative delta every single day, including Friday, which closed up 42.5 points on −4,445 delta. Price lifted off the low on Friday while sellers were still leaning on the bid. That's the divergence that defines August so far on both instruments: the buying that mattered happened in the first 48 hours, and the rest of the week was price holding gains while the order flow underneath it cooled off.
Last Week, Up Close
Monday, August 3 was the session that set the tone. MNQ opened at 28,567.50, tagged a low of 28,313.0, and closed at 28,929.25 — up 361.75 points on +15,021 net delta. The low-to-close recovery was 616.25 points. That's a genuine session: price and delta moved together, buyers were lifting the offer, and the tape had conviction behind it. MES ran the same shape — +14,174 delta, up 81.5 points, recovering 88.5 points off the low.
Tuesday, August 4 was the week's real session. MNQ printed +35,926 delta — the largest single-session delta count of the week by a wide margin — and closed up 889 points at 29,819.0. The high of 29,956.50 stood as the week's peak until Wednesday. MES matched it: +16,433 delta, up 143.75 points, closing at 7,774.50. Two sessions in, both instruments had done the heavy lifting. The order flow was there, the price move was there, and the story looked clean.
Then Wednesday arrived. MNQ opened at 29,781.25, tagged a high of 30,073.25 — the week's absolute high — and closed at 29,594.75, down 186.5 points on −25,686 delta. That's 478.5 points sold off the high on the session. The selling was real: −25,686 is the week's largest negative delta print, and it came on the day price was making new highs. MES did the same: −10,817 delta, down 14.25 points, fading 61.75 points off a high of 7,820.25. The week's high on both instruments was Wednesday's high, and both markets spent the rest of the week below it.
Thursday, August 6 continued the pressure. MNQ: −12,801 delta, down 71.5 points, with a low of 29,241.0 before recovering to close at 29,504.50. MES: −9,264 delta, down 26.25 points. Two straight sessions of sellers leaning on the bid after the week's highs were in.
Friday, August 7 is the one that needs the most scrutiny. MNQ closed up 326 points at 29,841.0 — the week's closing high. But net delta was +492. On a session that traded a 412.25-point range and recovered 386 points off the low, +492 delta is essentially flat. Price closed near the high of the day; the order flow behind it was nearly absent. MES closed up 42.5 points on −4,445 delta — price higher, sellers still leaning on the bid. Friday's close looks strong on a price chart. The order flow says something quieter.
Levels I'm Watching
These come from our conviction* zones — persistent order flow at specific prices, not lines drawn freehand.
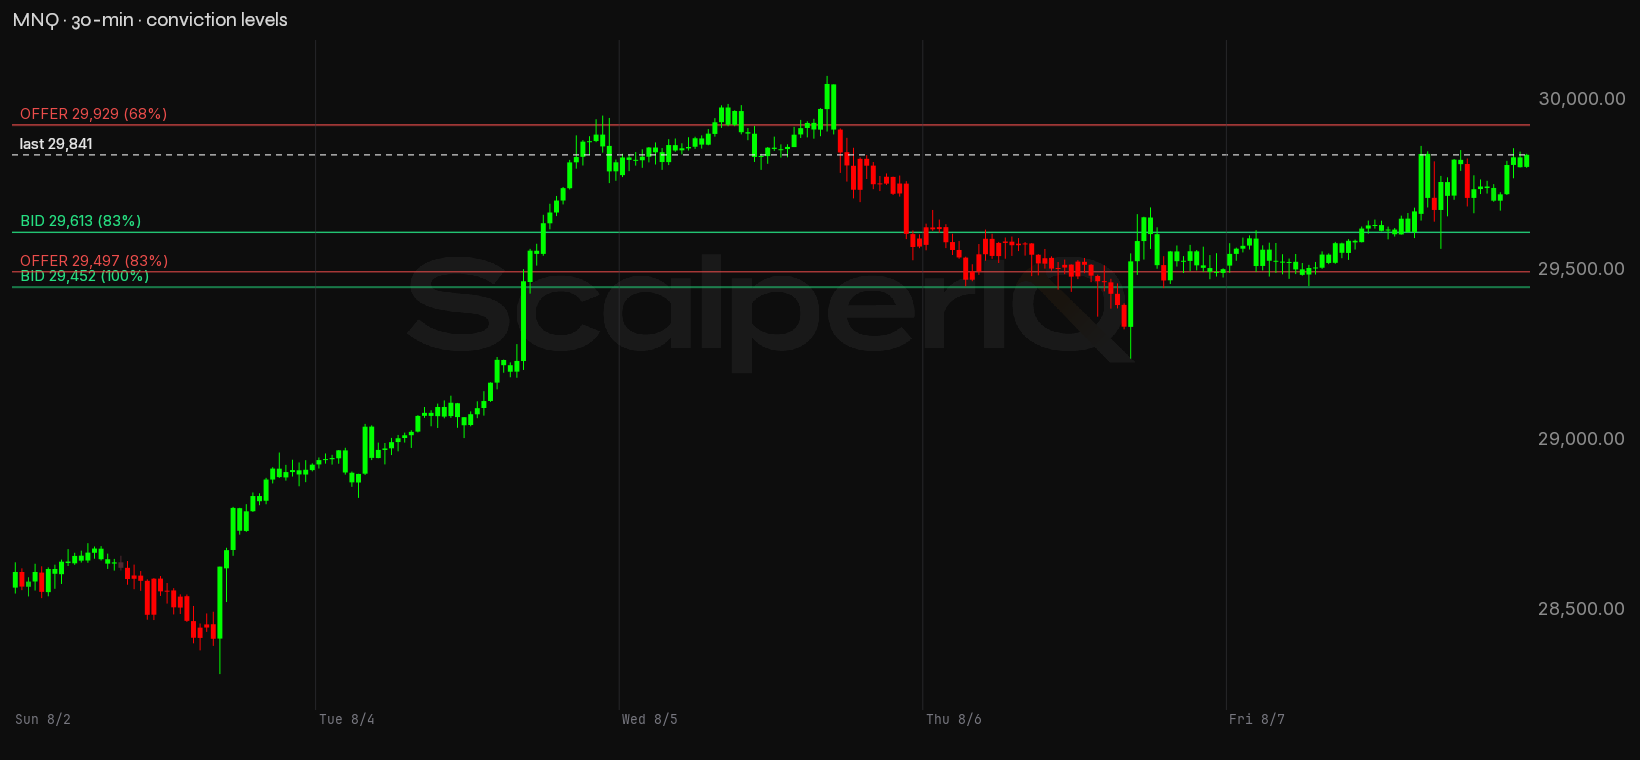
MNQ conviction zones
| Zone | Price | Read |
|---|---|---|
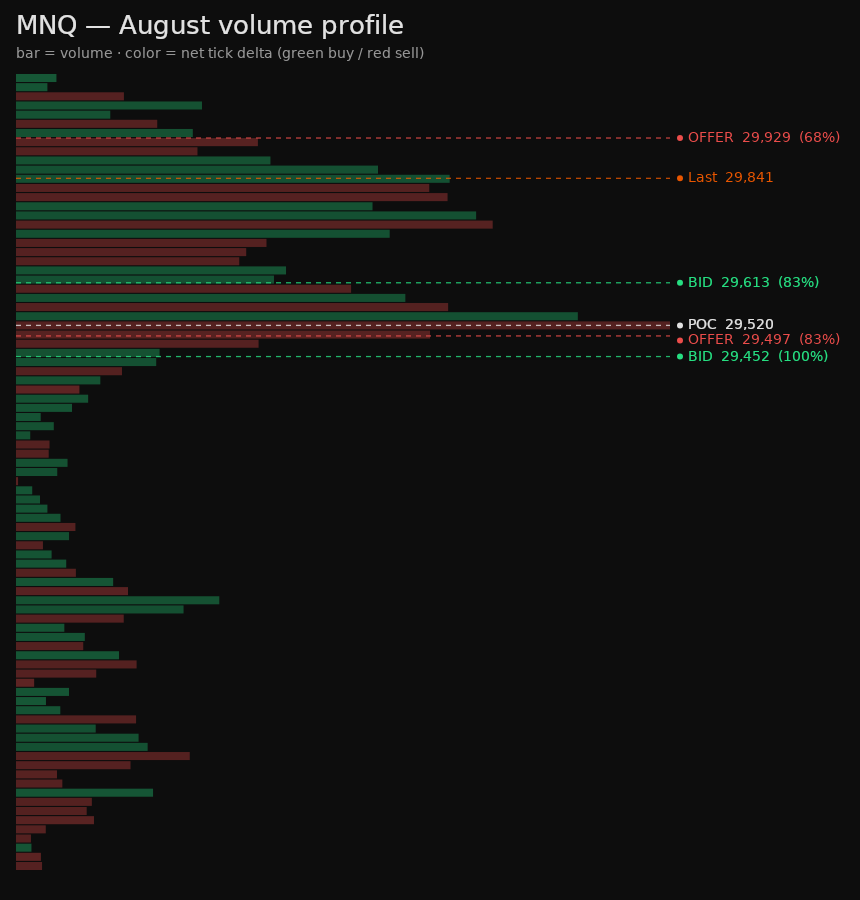
| Re-offer | 29,929 (29,928–29,930) | Supply shelf — 68% conviction. |
| Re-offer | 29,497 (29,495–29,499) | Supply shelf — 83% conviction. |
| Bid | 29,613 (29,610–29,617) | Demand cluster — 83% conviction. |
| Bid | 29,452 (29,451–29,453) | Demand cluster — 100% conviction. |
| Line in the sand | 28,313 | Last week's low — losing it is where I'd step back and reassess the bounce. |
MNQ closed Friday at 29,841.0. Three levels sit below the close; one sits above. The first thing above is the weekly offer shelf at 29,929 — 88 points up, 68% conviction. That's the nearest overhead level within the last quarter, and it's close enough that Friday's high of 29,867.25 was already sniffing at it. A session that pushes through 29,929 on rising delta would be meaningful; a session that tags it and fades would be the third consecutive rejection of the highs.
Below the close, the nearest support is the weekly bid shelf at 29,613 — 228 points down, 83% conviction. That level carries more one-sidedness than the overhead shelf, which is worth noting: the support below is better-defined than the resistance above. Below that, the 29,497–29,499 offer shelf sits 344 points below the close at 29,497, 83% conviction — this was resistance that price broke through on the way up, and it's now the level to watch if 29,613 gives way. Deeper still, the 29,452 bid shelf at 100% conviction sits 389 points below the close — the most one-sided level in the MNQ set, and the floor that matters if the week's gains start unwinding.
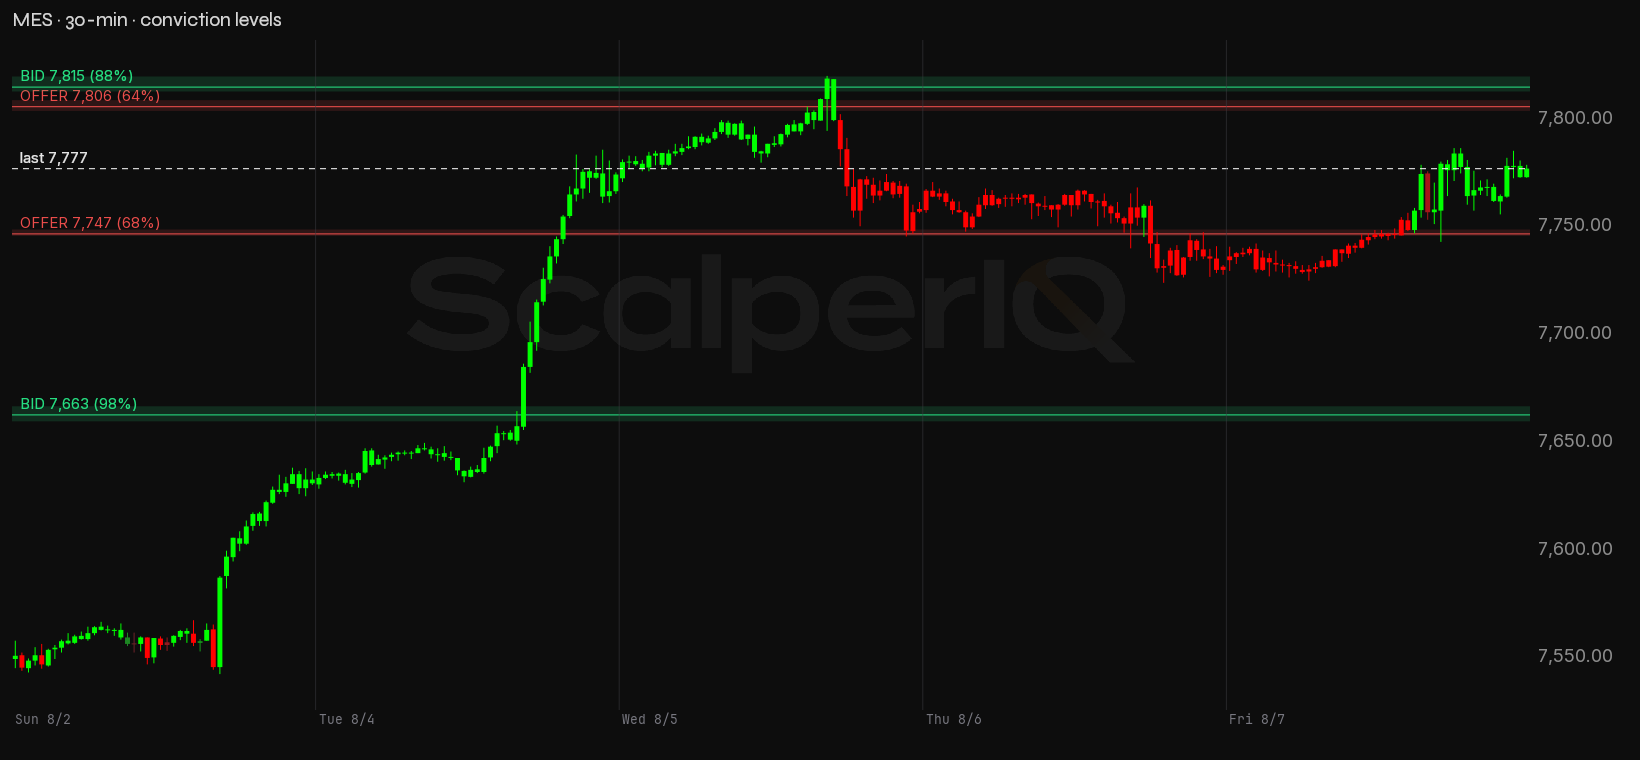
MES conviction zones
| Zone | Price | Read |
|---|---|---|
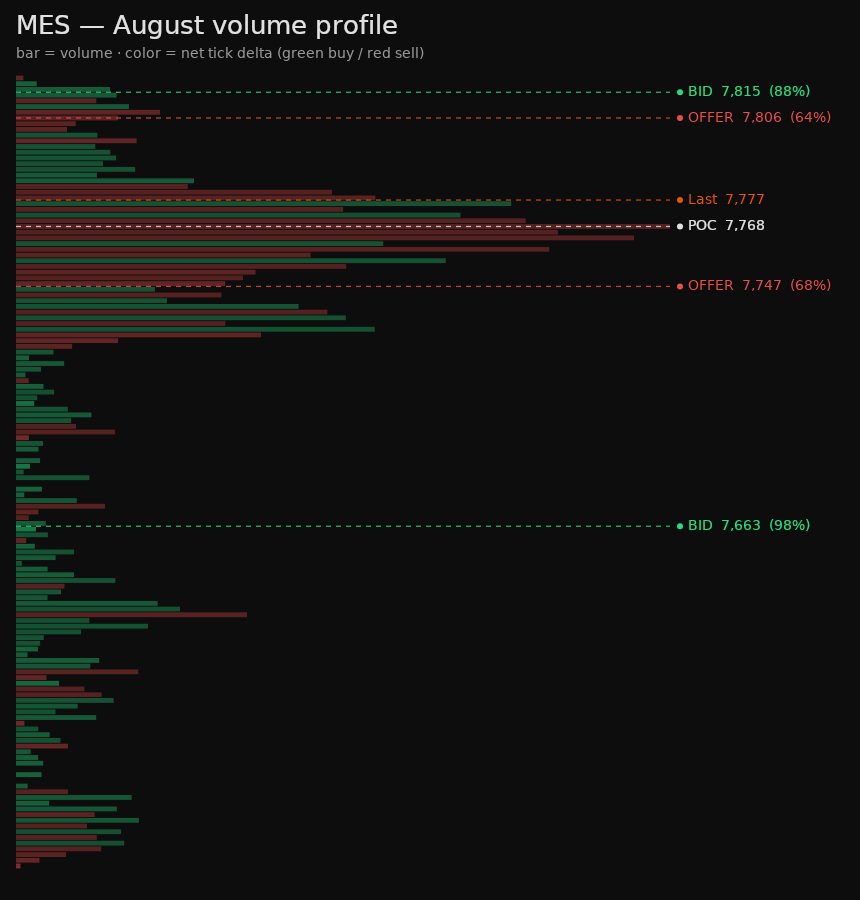
| Re-offer | 7,806 (7,804–7,809) | Supply shelf — 64% conviction. |
| Re-offer | 7,747 (7,746–7,749) | Supply shelf — 68% conviction. |
| Bid | 7,815 (7,813–7,820) | Demand cluster — 88% conviction. |
| Bid | 7,663 (7,660–7,667) | Demand cluster — 98% conviction. |
| Line in the sand | 7,543 | Last week's low — losing it is where I'd step back and reassess the bounce. |
MES closed at 7,777.25. Two levels sit above the close and two sit below. The first thing overhead is the weekly offer shelf at 7,806 — 29 points up, 64% conviction. That's the nearest overhead level within the last quarter, and it's the thinnest conviction reading in the MES set. Above that, the weekly bid shelf at 7,815 sits 38 points above the close at 88% conviction — a buying zone that printed near the week's high of 7,820.25.
Below the close, the nearest support is the weekly offer shelf at 7,747 — 30 points down, 68% conviction. This was a selling zone that price pushed through on the way up; it's now the first thing MES leans on if the week's gains come under pressure. Deeper support is the weekly bid shelf at 7,663, 114 points below the close at 98% conviction — the strongest level in the MES set and the one that would need to hold for the broader move to stay intact.
The one thing I need to see: a session on MNQ where price closes above 29,929 and net delta is genuinely positive — buyers lifting the offer through that shelf, not price drifting past it on thin flow.
On the Calendar
The scheduled risk worth timing around this week:
- Wednesday, August 12 — CPI (Jul 2026 data), 8:30 AM ET. Order flow runs thin and jumpy into the print, and the first reaction is often noisy before delta picks a direction.
- Thursday, August 13 — PPI (Jul 2026 data), 8:30 AM ET. Usually a smaller reaction than CPI but can still stir the tape — a volatility warm-up for the inflation data.
- Thursday, August 13 — Initial Jobless Claims, 8:30 AM ET. Low-impact most weeks, but an elevated reading can stir near-term volatility around the number.
- Friday, August 14 — Retail Sales (Jul 2026 data), 8:30 AM ET. A miss or beat can swing MES and MNQ several points in the first minute, with jumpy two-sided flow around the print.
All four events land at 8:30 AM ET. Wednesday's CPI is the one that will move the tape most; Thursday doubles up with PPI and Claims in the same window. The book goes thin ahead of each print and the first spike is usually noise — what matters is where delta settles once the dust clears.
Bottom line
The move off the lows is real — 1,557 points on MNQ, 274.75 on MES, both lines in the sand intact. But Wednesday and Thursday closed with sellers leaning on the bid, and Friday's 326-point close came on just +492 delta. The bias stays cautiously long while the 29,613 bid shelf holds, but the 29,929 offer shelf 88 points above Friday's close is the first real test, and MNQ is the instrument to watch — if it clears 29,929 on genuine buying delta, MES follows. If MNQ stalls there and delta turns negative again, the week's gains come into question.
* Conviction % — how one-sided the order flow was at that price. 100% means it traded essentially one direction; 50% means buyers and sellers fought it to a draw. It's a read on agreement, not size — a decisive level can still be a thin one.
* Delta means raw tick delta — executed buy volume minus sell volume, straight off the tape.
* MNQ / MES are the Micro E-mini Nasdaq-100 and S&P 500 futures — same index price action as the full-size NQ / ES, at a smaller contract size. We read the micros because they're where most retail order flow lives; the delta and volume figures here are micro-contract counts.
Delta Reads are my own read of the order flow — informational only, not financial advice and not a recommendation to buy or sell anything. Trading futures is not suitable for all persons: it carries a substantial risk of loss, and you can lose more than your initial investment. This is my interpretation of the data and it can contain errors — in the data, in the analysis, or both. Do your own due diligence and trade your own plan.

Get the Delta Reads
Our weekly order-flow read on MES and MNQ — what the tape did, and the levels we're watching next. One email a week. No noise.
See what ScalperIQ looks like on a live chart.
Try Free for 14 DaysNo credit card required in the US (outside the US, a card is required to start). Available on MotiveWave, EdgeProX, and NinjaTrader.