
Mastering Chart Clarity: How to Tailor ScalperIQ to Your Exact Trading Style

Get the Delta Reads
Our weekly order-flow read on MES and MNQ — what the tape did, and the levels we're watching next. One email a week. No noise.
I've spent a lot of time staring at screens, and if there is one thing I've learned from both building tools and trading with them, it's this: too much information is just as dangerous as too little.
We've all been there. You start with a clean chart, then you add a moving average. Then you add a VWAP. Then you add a volume profile. Then you add a MACD. Before you know it, you're looking at what I call "indicator soup." Your chart is a chaotic mess of overlapping lines, colored clouds, and flashing signals, and you can't even see the actual price action anymore.
When you're in the middle of a fast-moving market move, you don't need a puzzle to solve. You need clarity and something you can glance at and know if your setup exists quickly and as stress free as possible.
When I was developing ScalperIQ, I intentionally avoided building a "one-size-fits-all" indicator. Instead, I built something modular. The goal wasn't to give you more noise; it was to give you the ability to filter out everything that doesn't matter to your specific strategy.
The Danger of Indicator Soup
The problem with most trading setups isn't that the indicators are "wrong"—it's that they are irrelevant to the specific trade you're trying to take.
If you are a scalper looking for quick mean-reversion entries, a massive 200-period moving average might just be clutter. If you are a trend follower, you might not care about every delta pivot that happens during a consolidation phase.
The most successful traders are the ones who can strip away the noise and focus only on the data points that confirm their edge.
This is why ScalperIQ is designed to be toggled. You don't have to use every feature we've built. You can run the tool with just candle coloring and nothing else, or you can overlay zones and exhaustion markers while keeping your pivots hidden. The power lies in your ability to customize the tool to match your mental model of the market.
Granular Control: Your Chart, Your Rules
One of the things I'm most proud of in the current version of ScalperIQ is the level of granular control you have over what actually hits your screen.
Most indicators are "all or nothing." You turn them on, and they flood the chart. In ScalperIQ, you can decide exactly how much weight to give each type of order flow signal. You aren't limited to just "on" or "off." You can choose the quantity of signals for each category.
For example, you can set your chart to show:
- 2 Delta Zones (to keep your primary support/resistance levels visible)
- 1 Exhaustion Marker (to alert you when a trend is getting tired)
- 0 Delta Pivots (because you don't trade intraday shifts in control)
By setting limits like this, you are effectively telling ScalperIQ: "Only show me the most significant events."
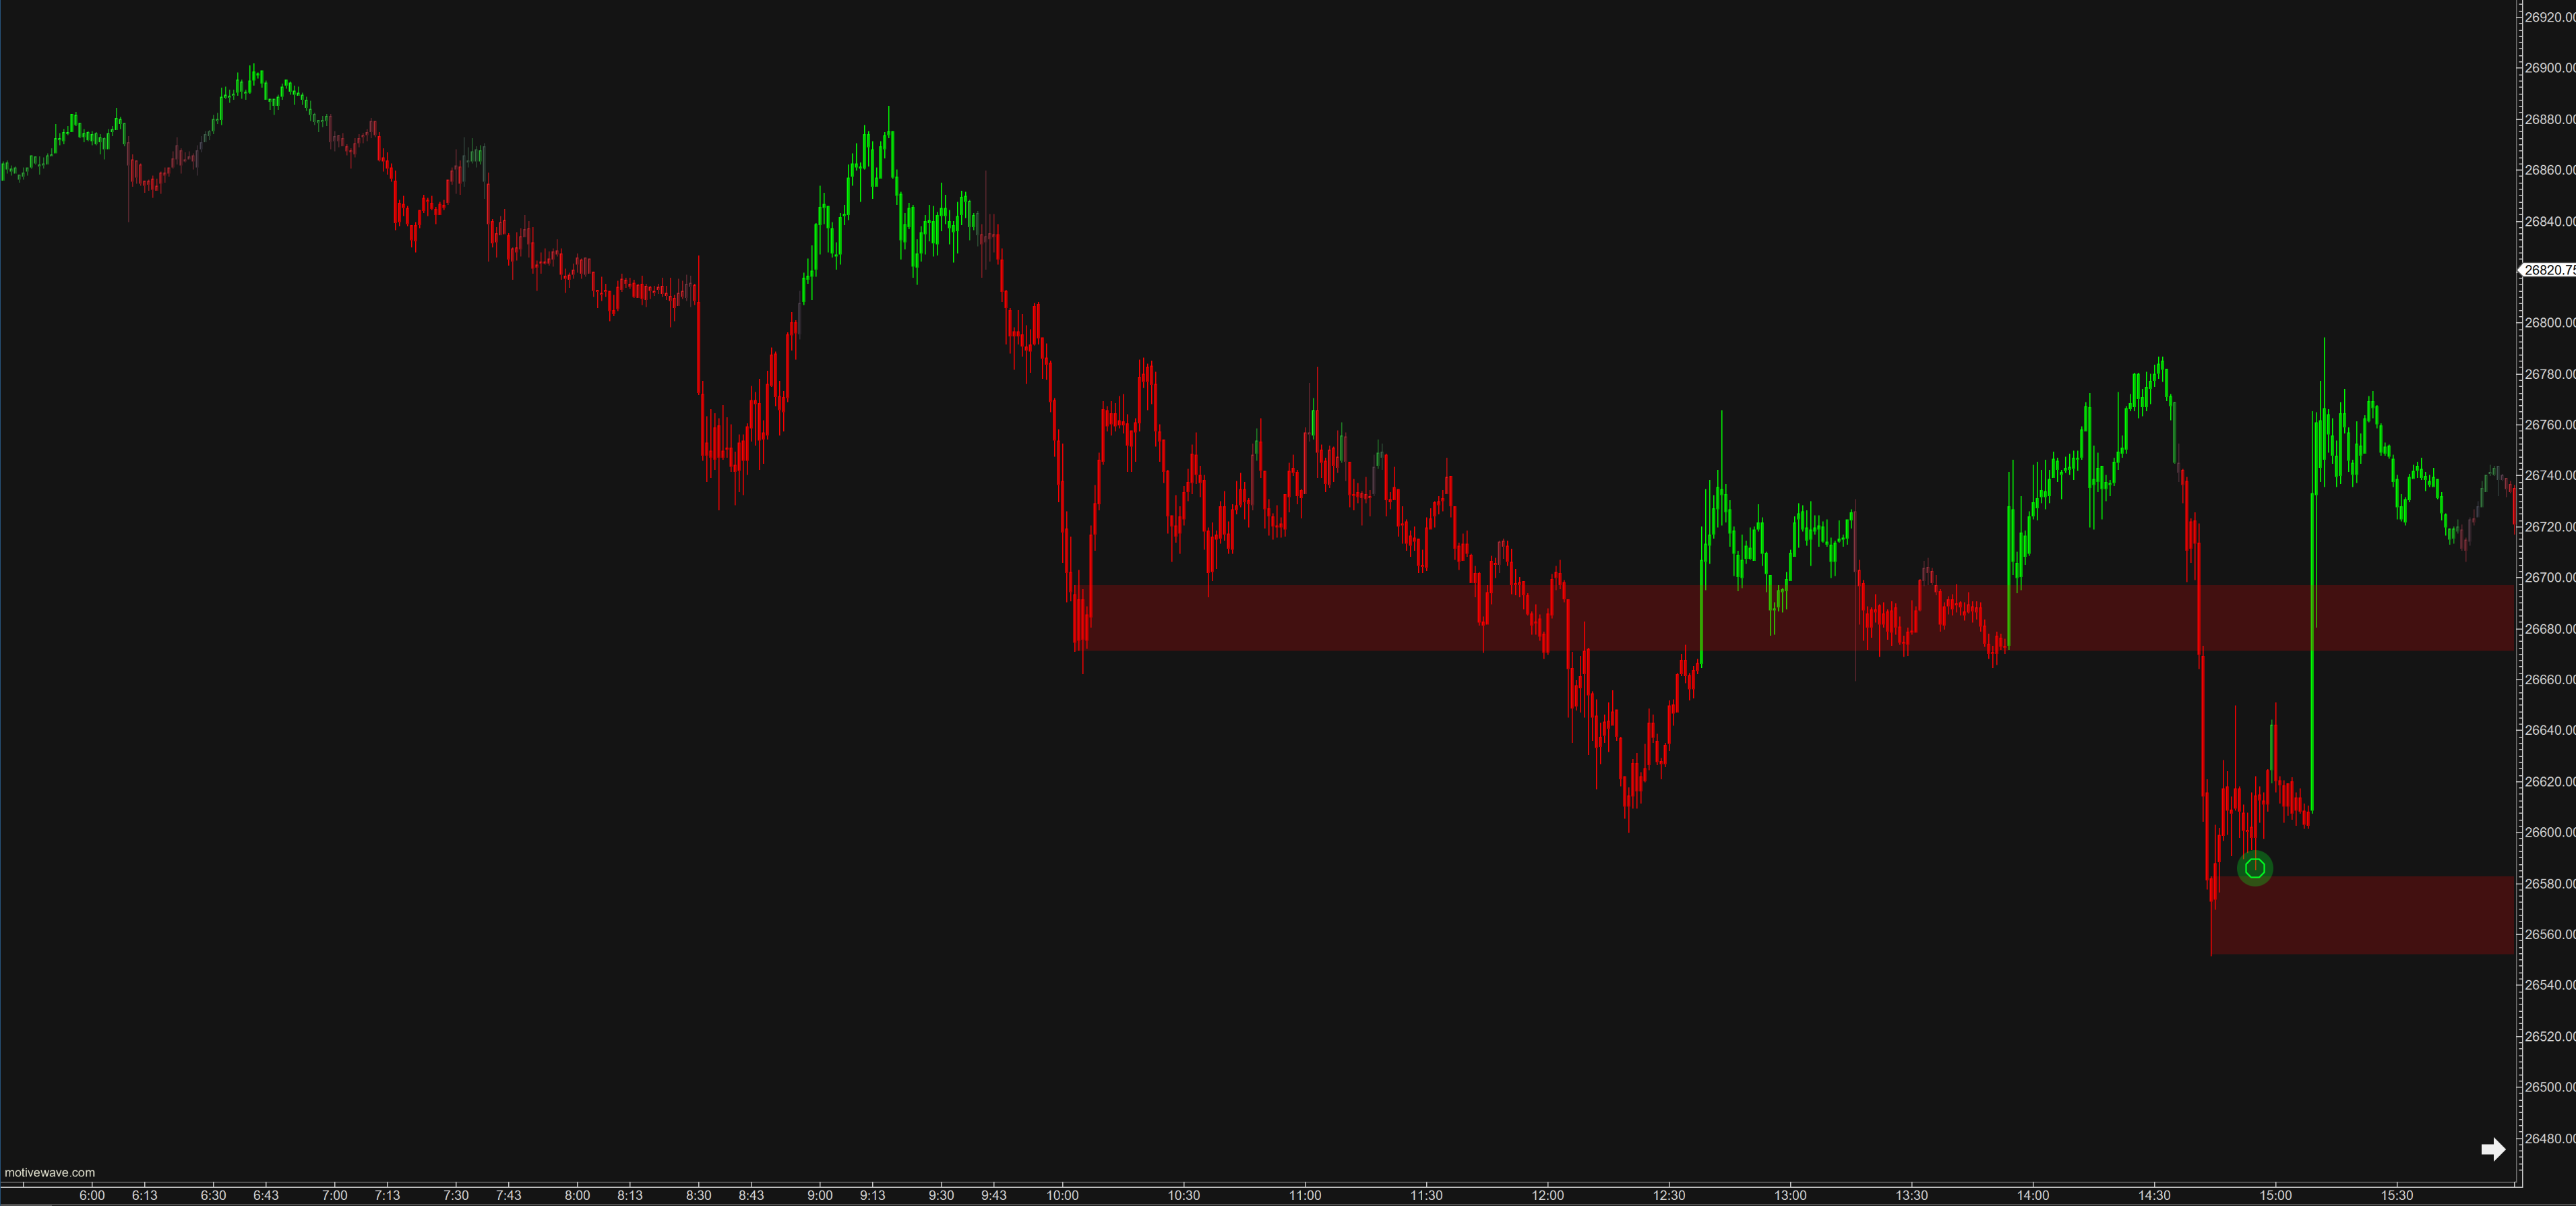
Here is why that matters: By limiting the number of signals, you force ScalperIQ to filter for intensity. You aren't seeing every little hiccup in the market; you are only seeing the moves that actually moved the needle.
The Ranking System: Strength Over Recency
This leads us to the "secret sauce" of how ScalperIQ manages your screen: The Ranking System.
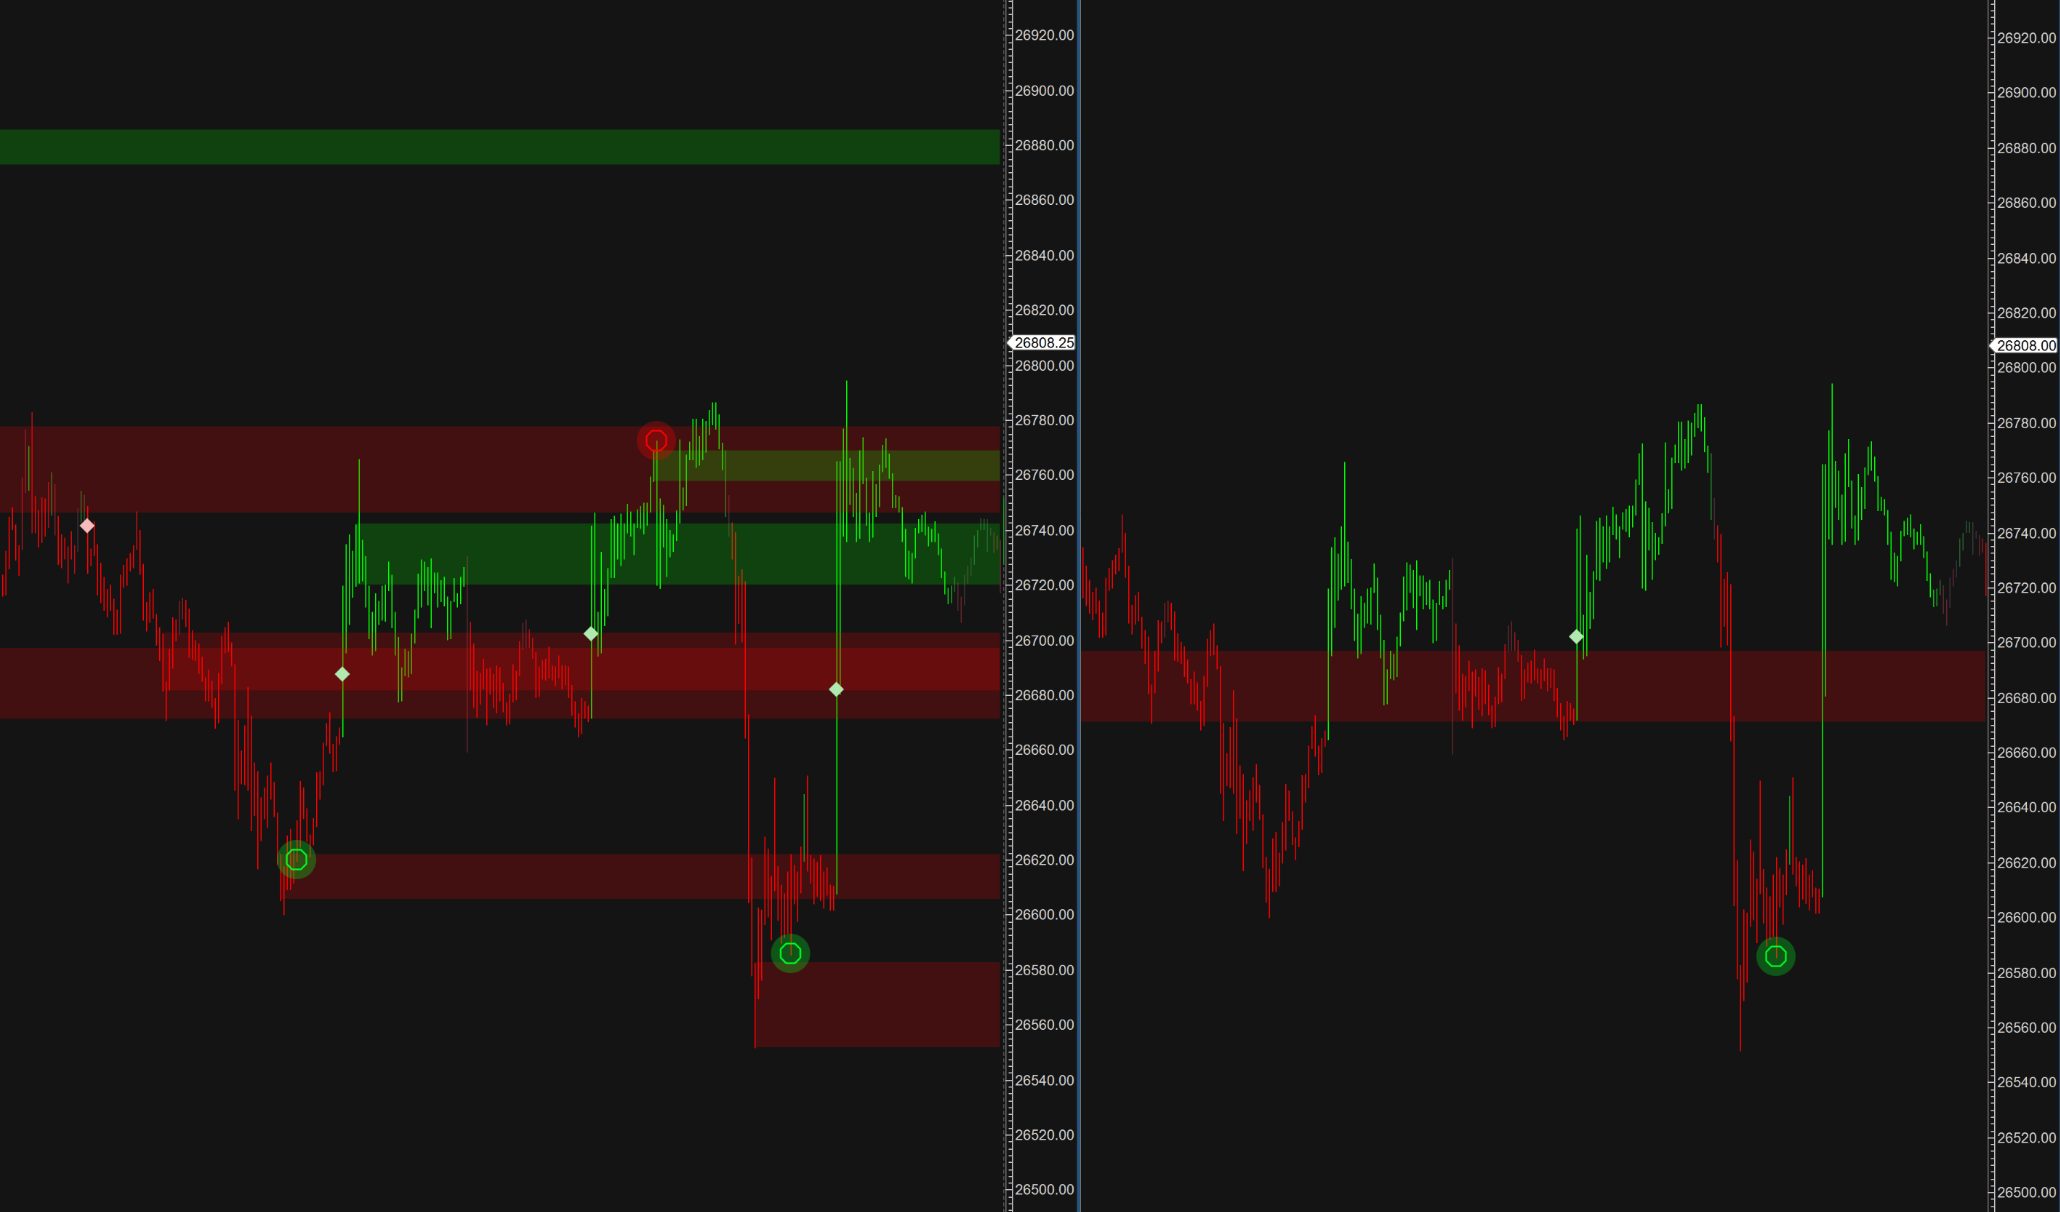
When you set a limit of say, a maximum of 2 Delta Zones—ScalperIQ doesn't just pick the two most recent zones. It doesn't care if a zone formed five minutes ago or fifty minutes ago. Instead, it ranks signals by their intensity.
The system looks at the underlying delta volume and the magnitude of the pressure. The signal with the highest intensity becomes your #1 ranked feature. The second strongest becomes #2, and so on. If a new, much more aggressive zone forms, it will automatically "bump" the weaker one off your chart.
The 1st feature shown is always the strongest/most relevant; the 10th feature is the weakest.
This creates a dynamic chart that evolves in real-time. As the market moves from a period of low-volatility accumulation into a high-volatility breakout, your chart will physically change to reflect that shift in energy. The weaker, "stale" levels disappear, and the high-impact, high-intensity levels take center stage.
The takeaway here is simple: You don't have to manually clean up your chart. ScalperIQ is constantly performing a "strength audit" on the market, ensuring that the levels you are looking at are the ones that actually have the most aggressive participants behind them.
Tailoring the Tool to Your Strategy
So, how do you actually apply this? Since I don't know your specific strategy, I'll give you three different "templates" of how traders in our Discord community often set up their ScalperIQ charts.
1. The Scalper
- Setup: Enable Candle Coloring (with IQBoost on) and Delta Pivots.
- Limit: Set a low limit for Pivots (e.g., 2 or 3) to avoid clutter.
- Goal: Identify rapid shifts in control by watching for color flips and pivot markers.
- Context: These signals must be used alongside key levels like PDH/PDL or major zones. Avoid treating a pivot as a "marker in space"; look for it to occur at a level of interest.
2. The Trend Follower
- Setup: Enable Candle Coloring and Exhaustion Markers.
- Limit: Set a low limit for Exhaustion Markers (e.g., 1 or 2) to focus only on high-conviction fatigue.
- Goal: Detect when a directional move is losing momentum and potential reversal points.
- Context: Use the candle colors to confirm the strength of the current trend and look for exhaustion markers to signal when the market structure may be shifting from expansion to consolidation.
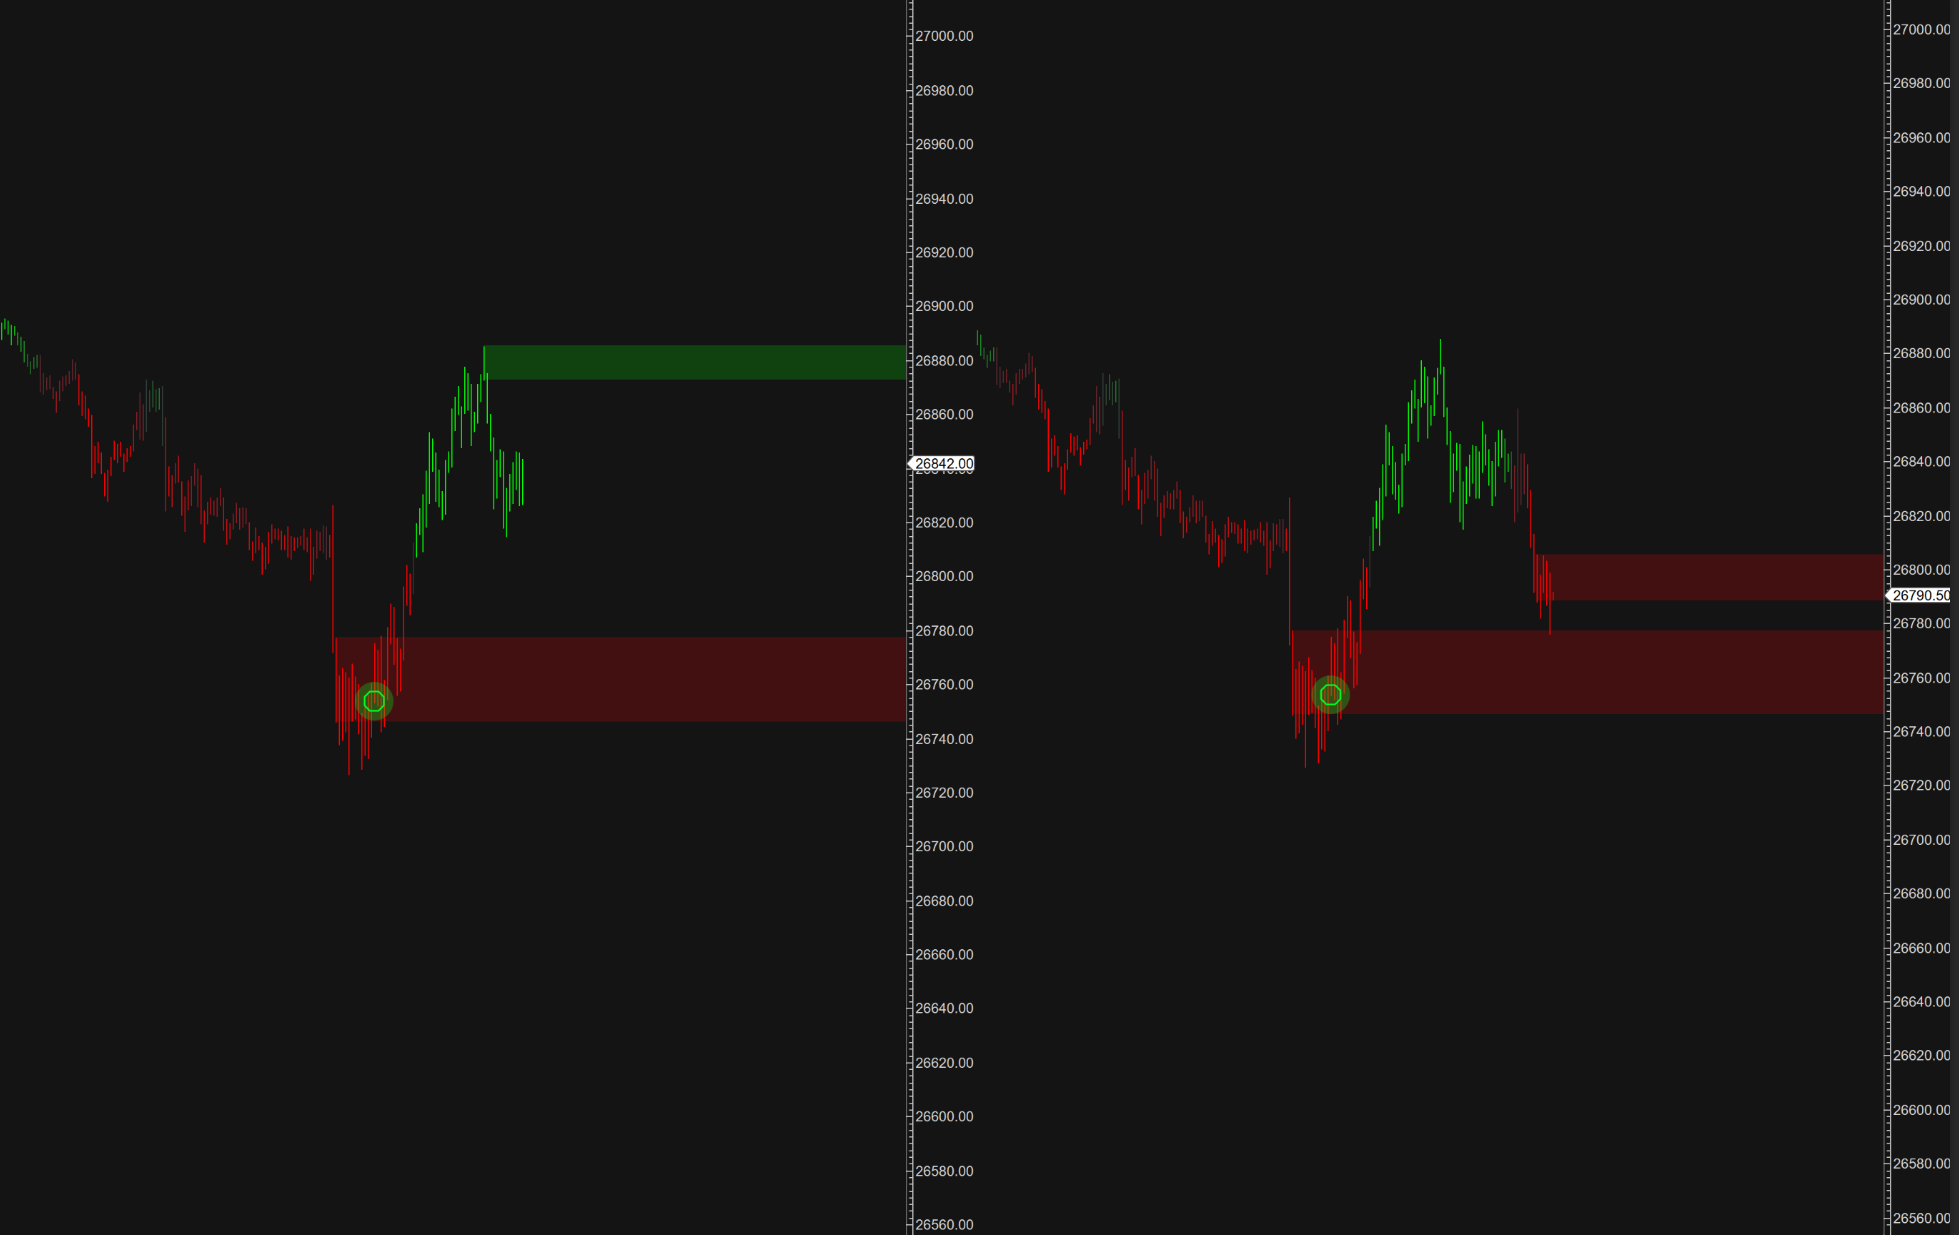
3. The Breakout Trader
- Setup: Enable Delta Zones and Candle Coloring.
- Limit: Monitor high-intensity zones that have recently been breached.
- Goal: Capture momentum as price moves through established areas of supply or demand.
- Context: Zones at the top or bottom of a move often act as temporary resistance or support. A great breakout setup occurs when price moves to the other side of a zone, holds above/below it, and the candle coloring provides directional support.
Final Thoughts
At the end of the day, ScalperIQ is a lens, not a crystal ball.
If your lens is dirty or out of focus, you're going to misinterpret what the market is doing. By using the modular design—toggling features off, setting strict limits on signal counts, and letting the ranking system prioritize intensity—you can create a customized view that highlights exactly what you need to see to execute your plan.
Don't trade the noise. Trade the signal.
If you're struggling to find the right setup, I highly recommend jumping into our Discord. We have traders of all different styles constantly sharing their chart configurations. It's a great way to see how others are using these tools to filter out the junk and focus on the edge.


Get the Delta Reads
Our weekly order-flow read on MES and MNQ — what the tape did, and the levels we're watching next. One email a week. No noise.
See what ScalperIQ looks like on a live chart.
Try Free for 14 DaysNo credit card required. Available on MotiveWave, EdgeProX, and NinjaTrader.