
Avoiding FOMO: Using ScalperIQ Exhaustion Markers to Spot Failed Breakouts

Get the Delta Reads
Our weekly order-flow read on MES and MNQ — what the tape did, and the levels we're watching next. One email a week. No noise.
We’ve all been there.
The price is trending hard. It’s pushing toward a massive, obvious level—a yearly high, a session high, something that feels like "the move of the day." You see the green candles, the momentum looks unstoppable, and you start thinking, “If I don't get in now, I'm going to miss the entire move.”
That’s FOMO (Fear Of Missing Out) talking. It’s a loud, irrational voice that usually shows up right before a massive reversal.
Last week, we saw a textbook example of this play out on CL (Crude Oil). It was a high-stakes setup that involved not just technical levels, but a massive geopolitical shift that caught a lot of people on the wrong side of the trade. But more importantly, it was a setup where the order flow was screaming that the buyers were actually running out of steam long before the price collapsed.
The Setup: Chasing the Yearly High
The day started off with CL in a very clear, aggressive uptrend. It was pushing toward a brand new yearly high. For any trader looking at a standard candlestick chart, this looked like a "must-trade" breakout. The price was climbing, the momentum was there, and the psychological allure of a new yearly high is incredibly strong.
However, as price approached that level—within about 1 percent of the high—the behavior started to change.
While the price was still technically making higher highs, the aggressive buying pressure wasn't keeping pace with the price movement. This is what we call absorption. Buyers were hitting the ask, but sellers were sitting there with enough liquidity to soak up that aggression without letting the price blast through the level.
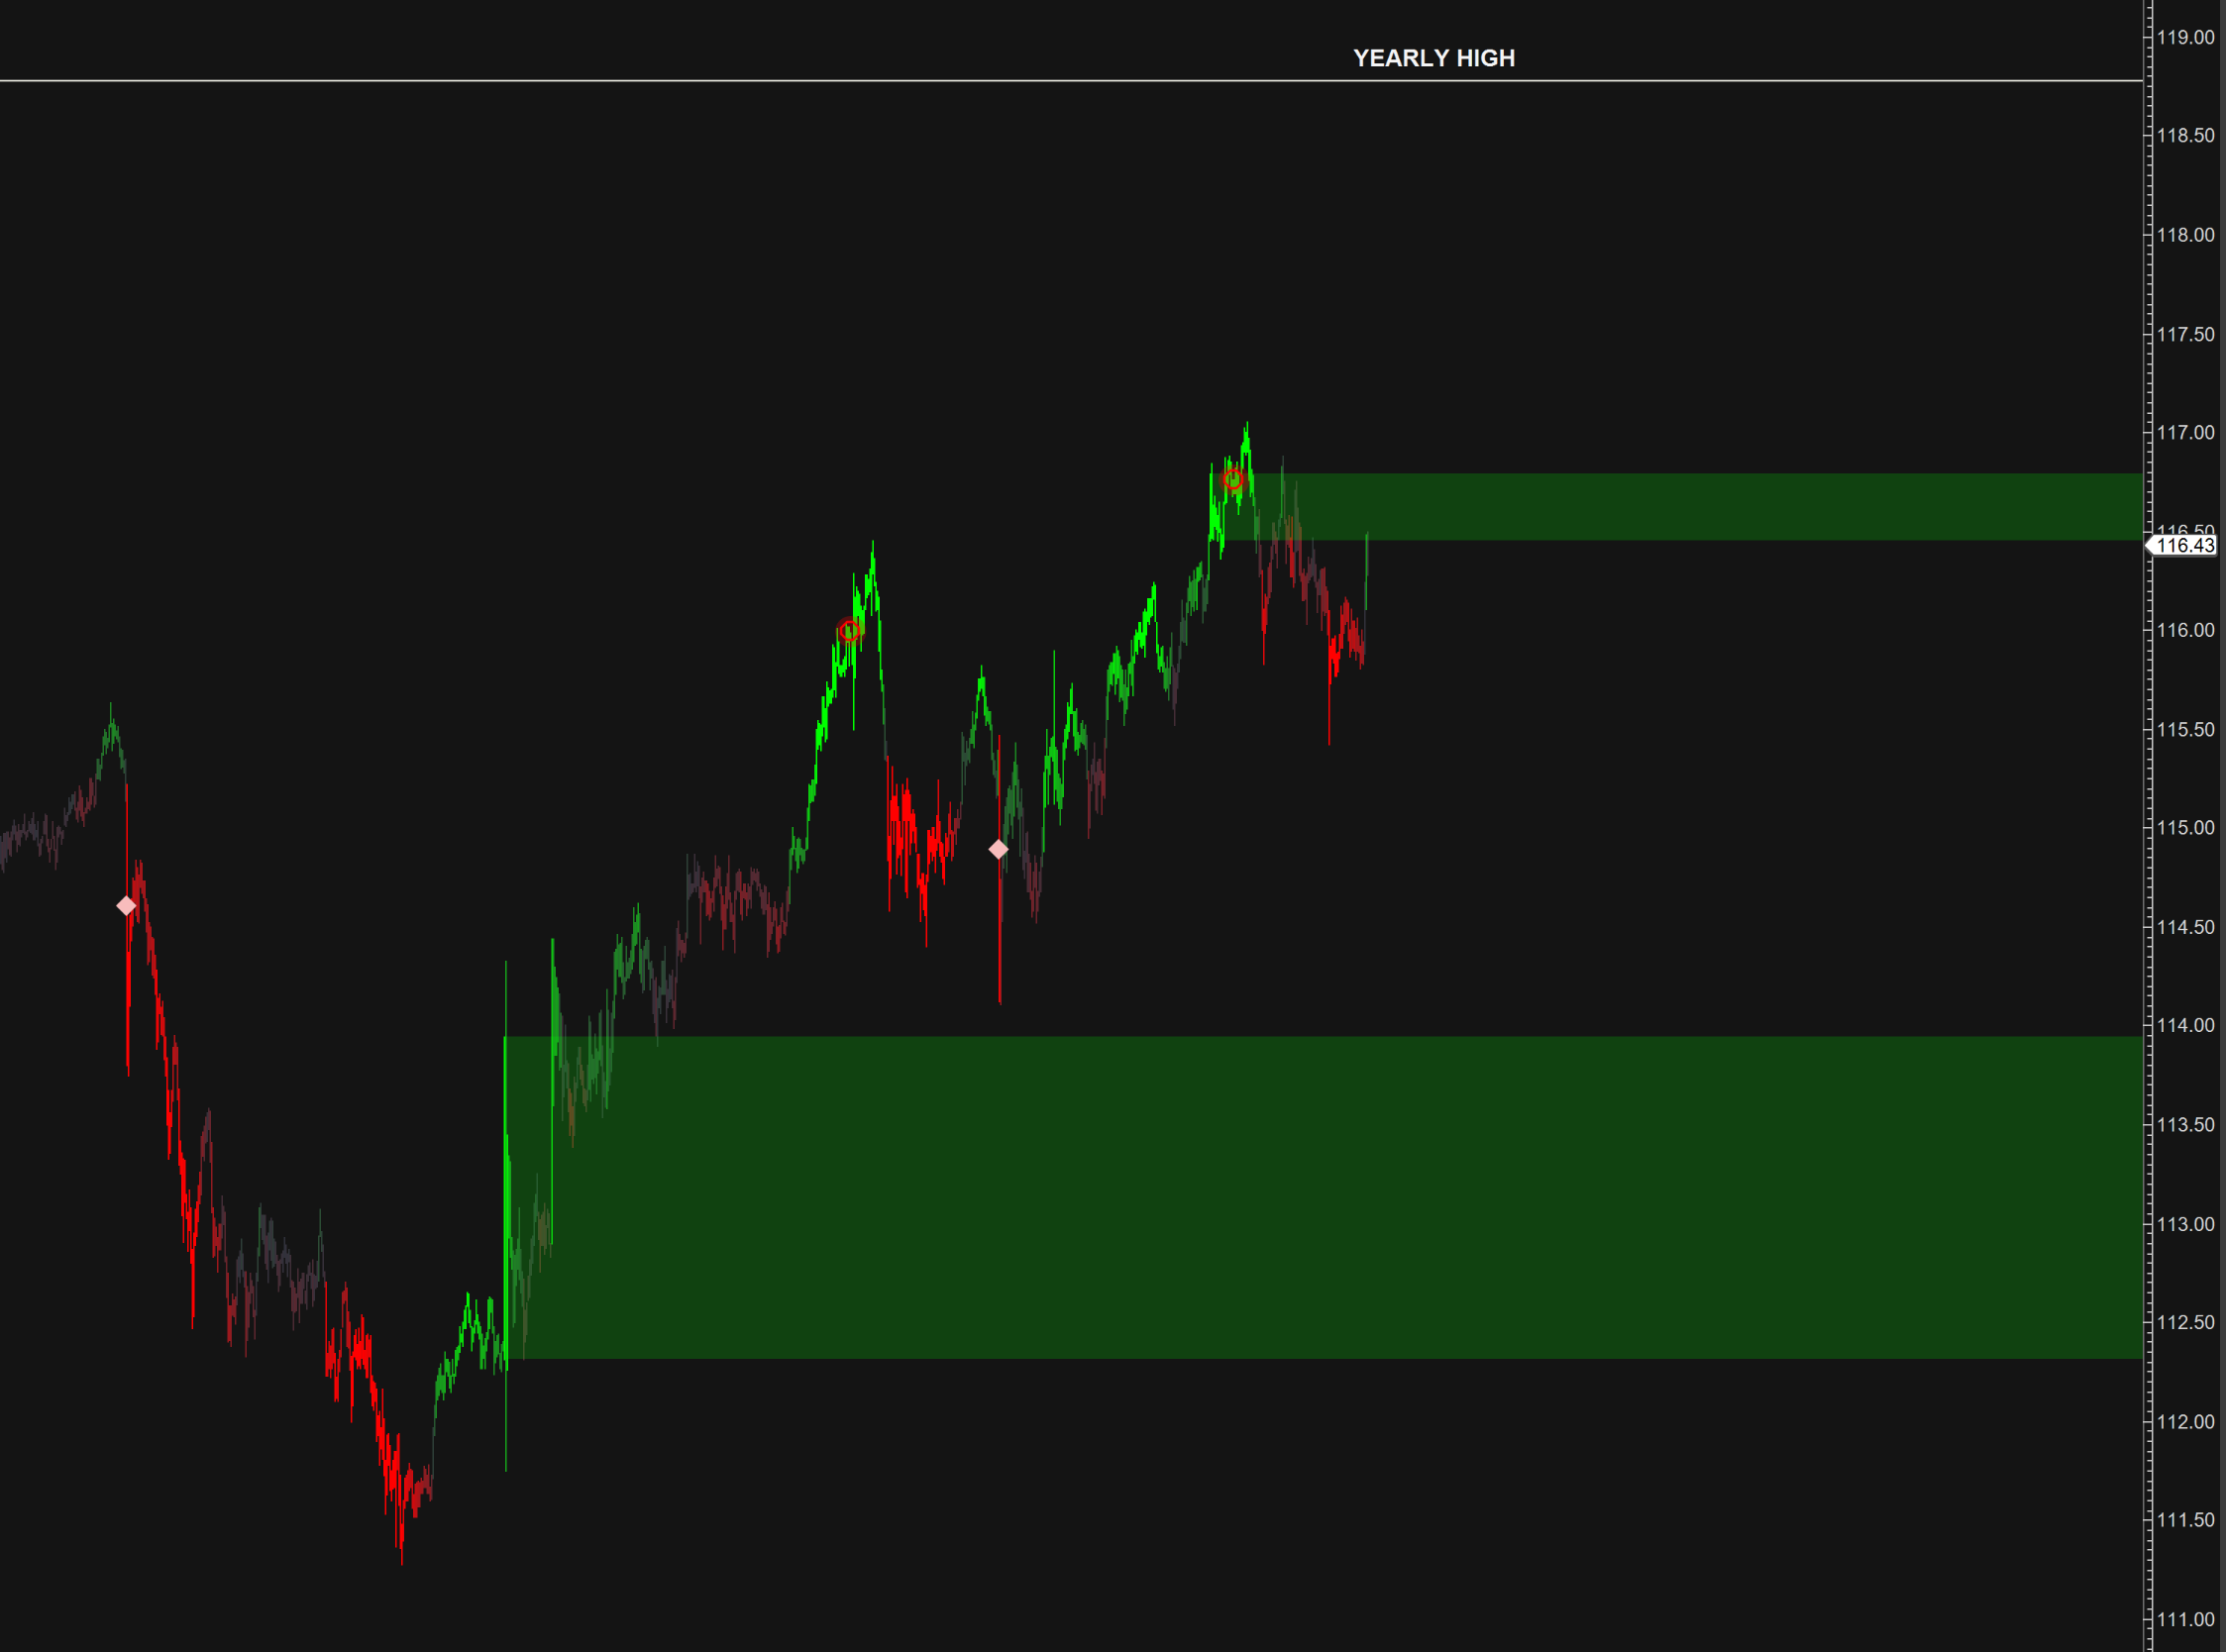
Here is why that matters: If you only look at price, you see a breakout in progress. If you look at the order flow, you see a struggle. Trading breakouts requires seeing more than just price movement; you need to see participation behind the move.
Spotting the Warning: The Exhaustion Marker
This is where the ScalperIQ comes into play.
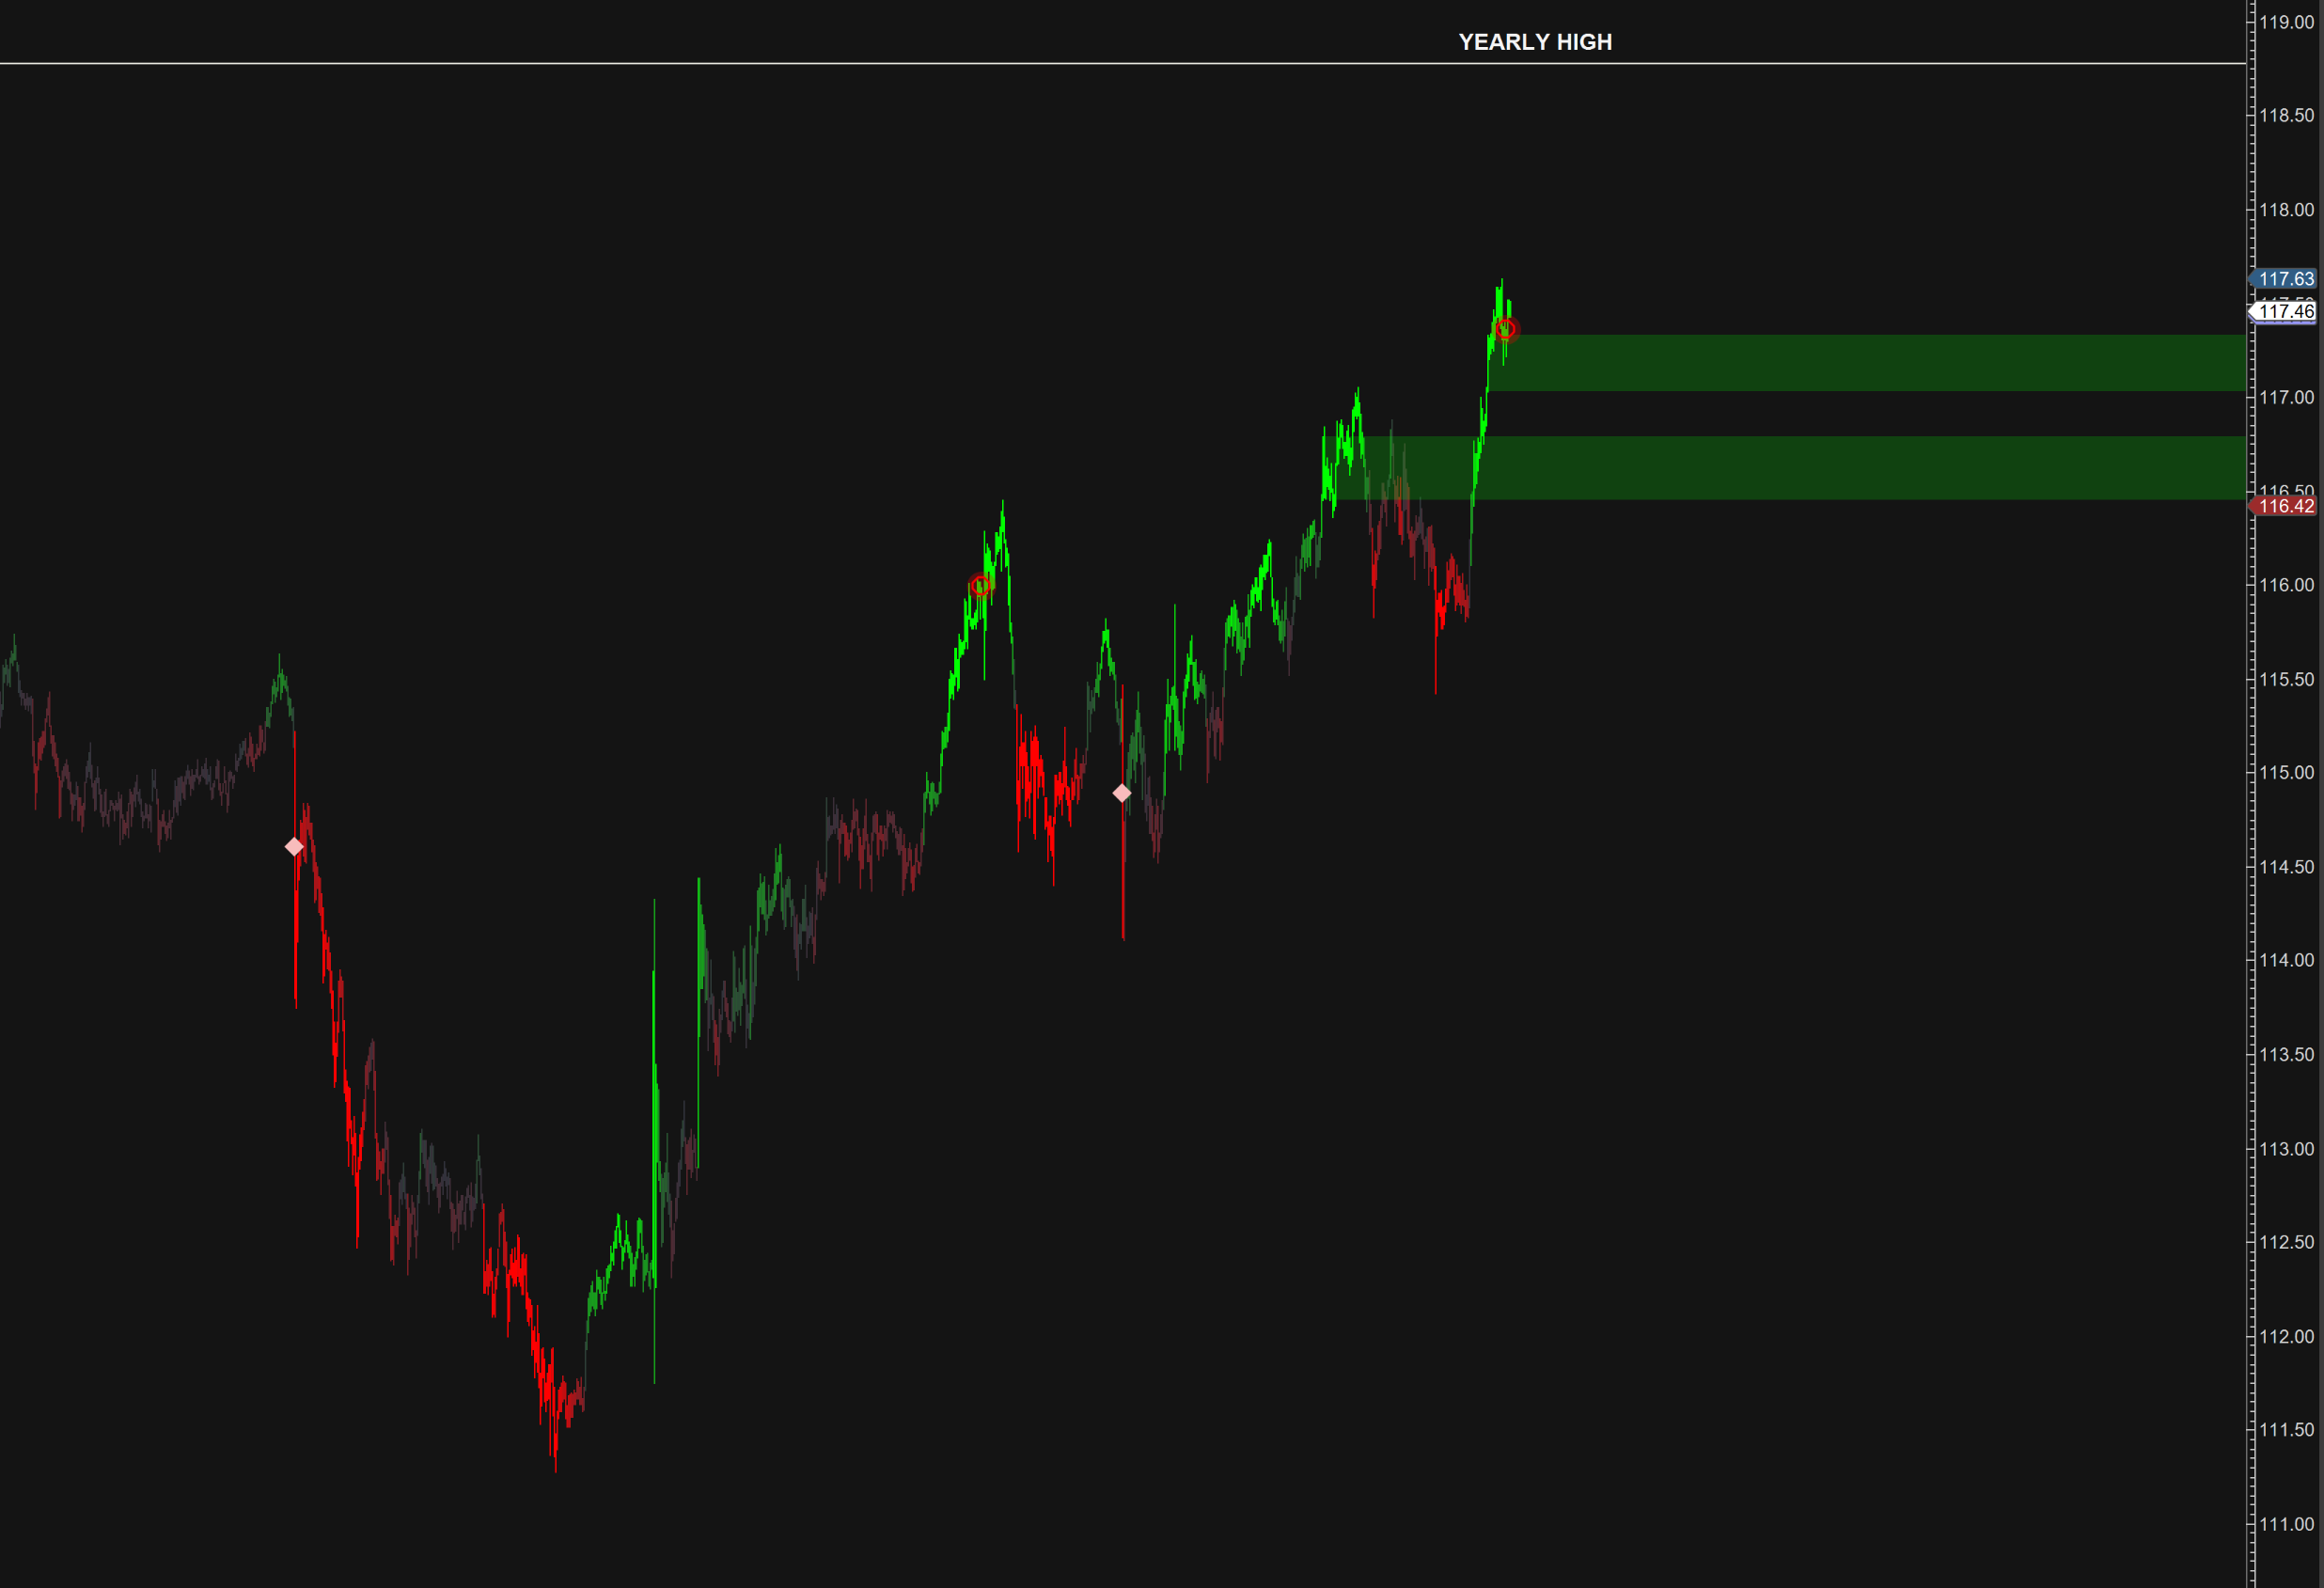
Watching the chart, ScalperIQ first flagged an aggressie buy zone. When you see these near resistance it's a reason to pause - it usually means buyers are getting too aggressive too fast. Then ScalperIQ flagged an Exhaustion Marker right near that peak. To understand why this happened, we have to look at how the tool works. The exhaustion marker isn't a magic "sell" signal. Instead, it tracks what we call a "hot bar" sequence—a string of consecutive high-momentum bars in one direction.
In this CL setup, we had a sustained run of aggressive buying. But then, the "cooldown" phase hit. The momentum dropped off. It detected that the sequence of high-intensity buying bars had been followed by bars with significantly lower delta intensity.
The exhaustion marker appeared at the top of the move, signaling that the aggressive buying pressure was drying up.
The market hadn't reversed yet, but the engine driving the move was beginning to sputter. The buyers were getting exhausted, and the "fuel" for the breakout was running low.
The takeaway here is simple: An exhaustion marker doesn't tell you to short the market immediately, but it tells you that the current trend is losing its structural integrity. It moves you from a state of "chasing the move" to a state of "watching for a potential reversal."
The Catalyst: When Exhaustion Meets News
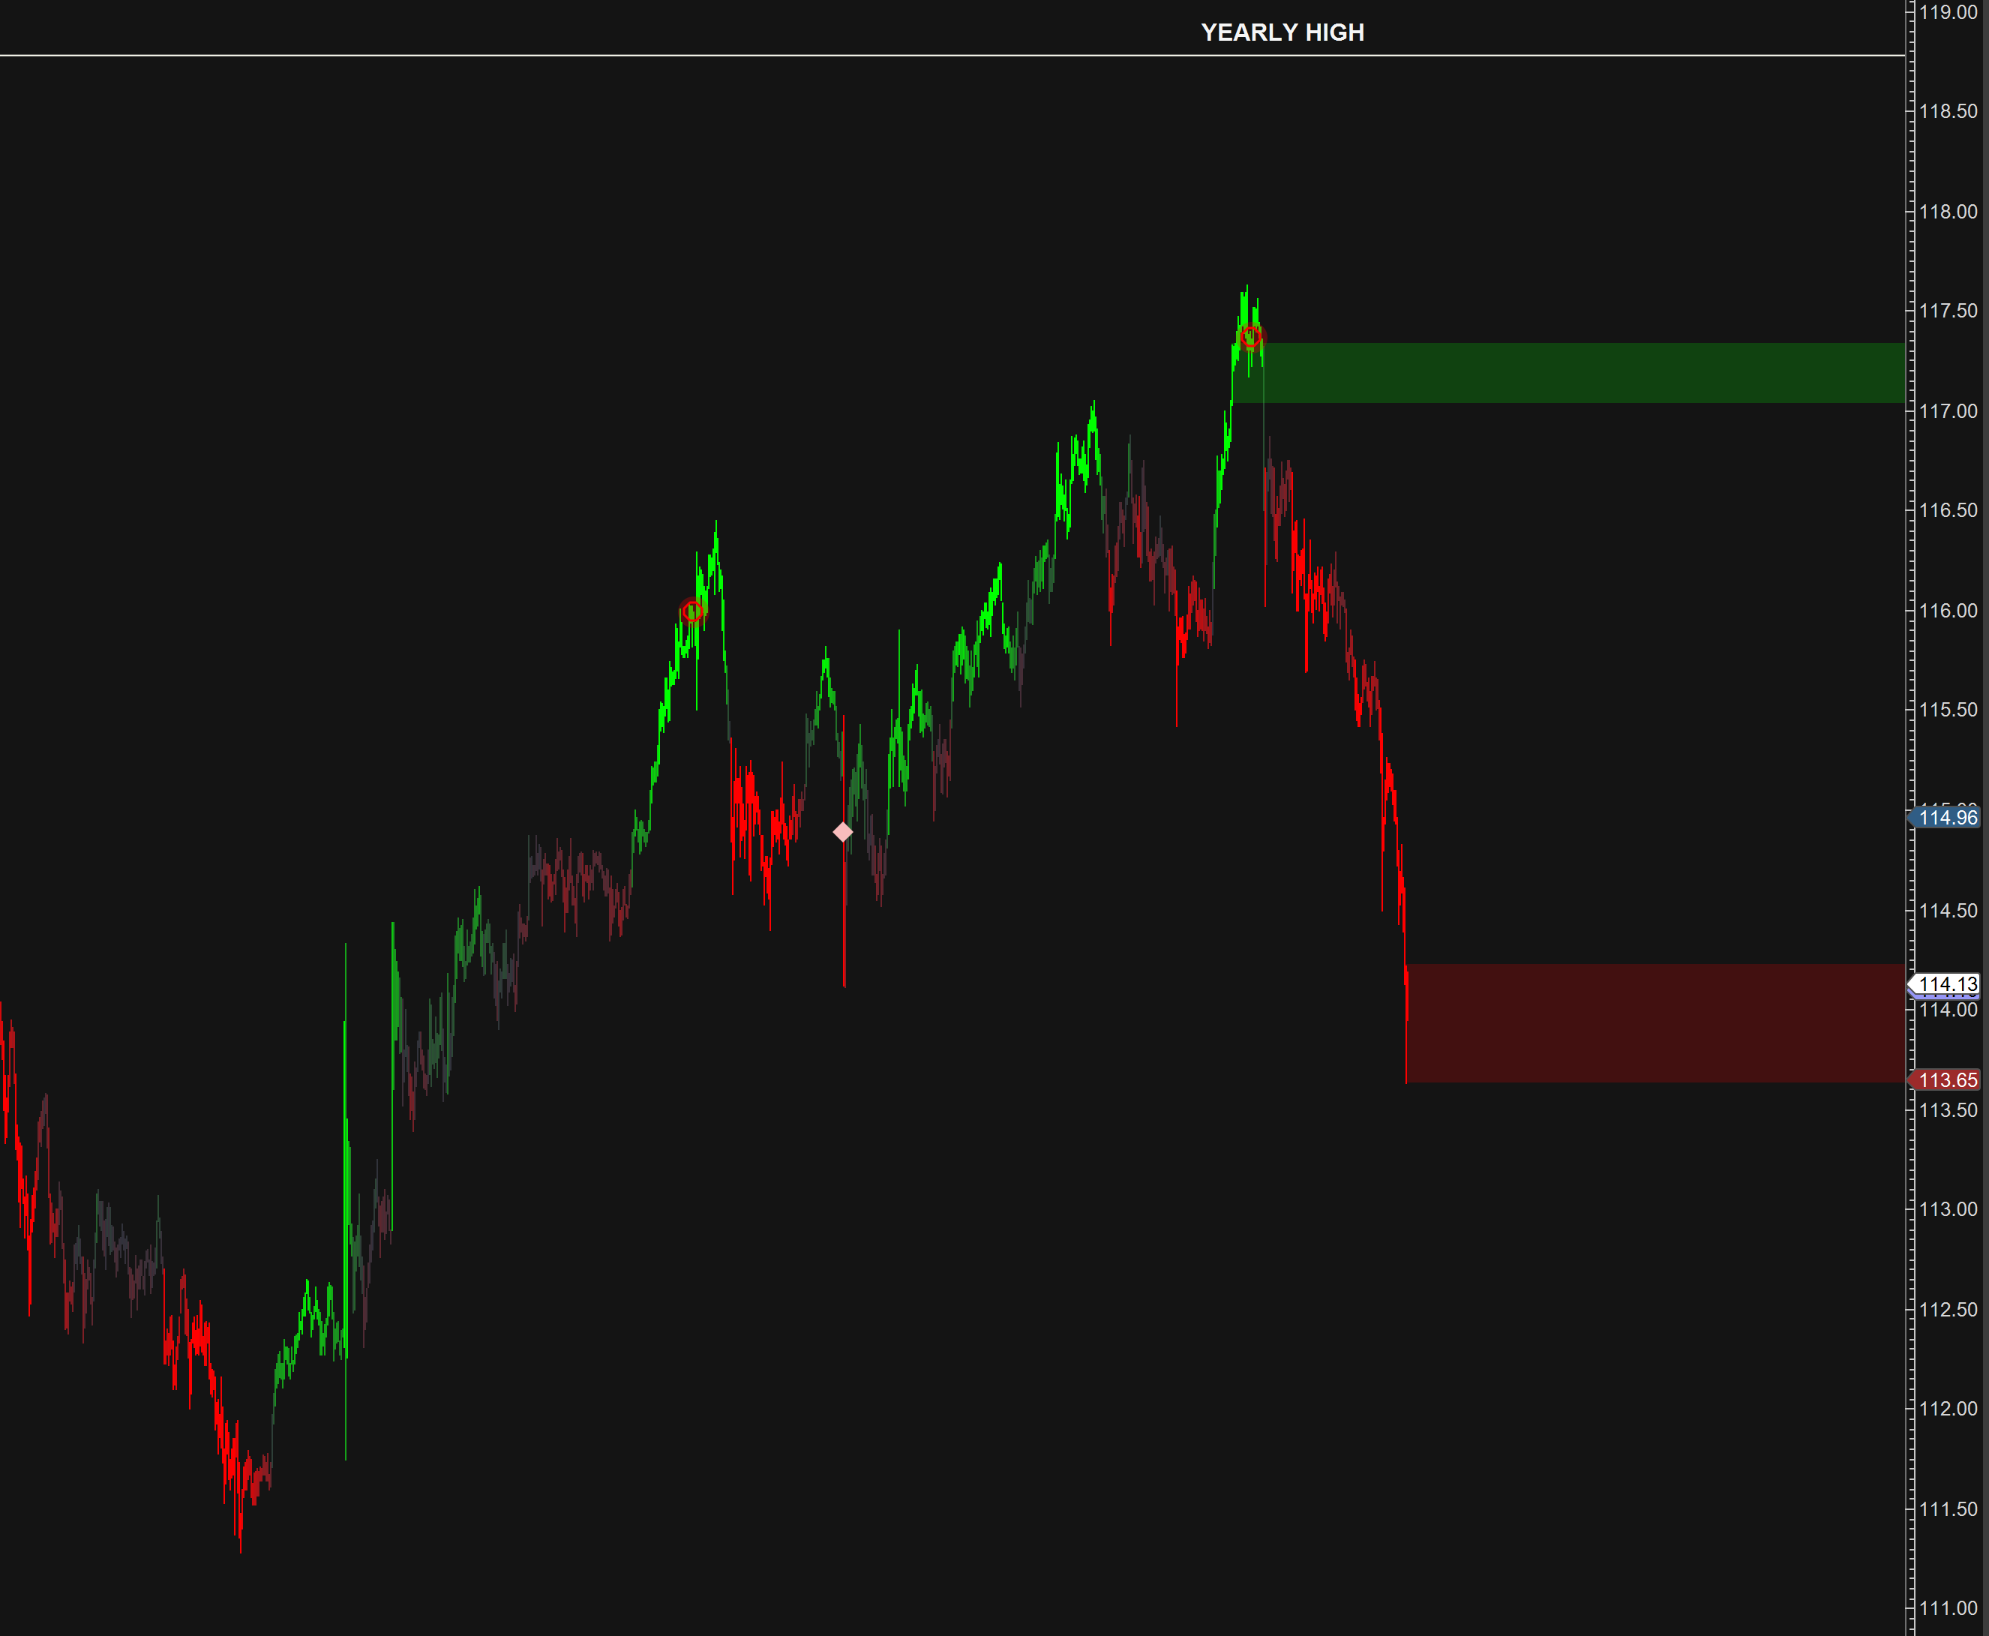
Of course, technical exhaustion often needs a catalyst to turn into a full-blown reversal. In today's case, that catalyst was a massive geopolitical headline: news regarding a potential ceasefire in the Iran war.
The impact was instantaneous. As soon as the news hit the wires, the market went from "stalling at a yearly high" to a massive 25% drop from the peak.
For traders who were FOMO-ing into long positions at the very top—thinking the breakout was confirmed—this was catastrophic. They were caught in a position where the technicals were already weakening, and then the fundamental floor was pulled out from under them. We can't know behind the scenes, but there's a saying amongst traders that "somebody" always knows the news before it drops - could have been the case here too.
The beauty of having the exhaustion marker on your screen is that it provides a layer of psychological defense. When you see that marker, you are reminded that the move is no longer "easy money." You are reminded that the aggressive participation required to break through a yearly high is fading when it should be climbing.
How to Use This in Your Own Trading
I don't want anyone thinking that ScalperIQ is a crystal ball that predicts news events. I'll be the first to tell you: trading is hard, and news can be unpredictable. I think all of us have lost money at least once because of an ill timed tweet in the last couple years.
The goal of using ScalperIQ tools like Delta Pivots, Zones, and Exhaustion Markers is to build a framework for contextual awareness.
When you're trading futures like CL or ES, you want to look for confluence. A high-probability setup isn't just a price level; it's a price level plus an order flow signal.
- Price is at a major resistance level.
- An Exhaustion Marker appears, showing the recent buying momentum is cooling.
- A color change of the candles from buy to sell showing sellers are now taking over control of the auction.
When those three things line up, you aren't guessing if a breakout will fail; you are observing the active decay of buying aggression.
The bottom line: Don't trade the hype; trade the behavior. When the price moves, look at the delta. If the price is rising but the delta is fading, the market is telling you something important. Listen to it.
And if you're trading with ScalperIQ all you need to do is glance at the candle color as the breakout starts. Is it a strong bright color? Or is it muted and more neutral? A glance is all you need to see if the breakout is strong or weak.
Until next time. Trade safe out there.

Get the Delta Reads
Our weekly order-flow read on MES and MNQ — what the tape did, and the levels we're watching next. One email a week. No noise.
See what ScalperIQ looks like on a live chart.
Try Free for 14 DaysNo credit card required. Available on MotiveWave, EdgeProX, and NinjaTrader.