
Delta Read · Week of September 28, 2026 — NQ Added 127 Points and ES Lost 29 — Same Week, Different Tapes, Neither One Clean
Get the Delta Reads
Our weekly order-flow read on MES and MNQ — what the tape did, and the levels we're watching next. One email a week. No noise.
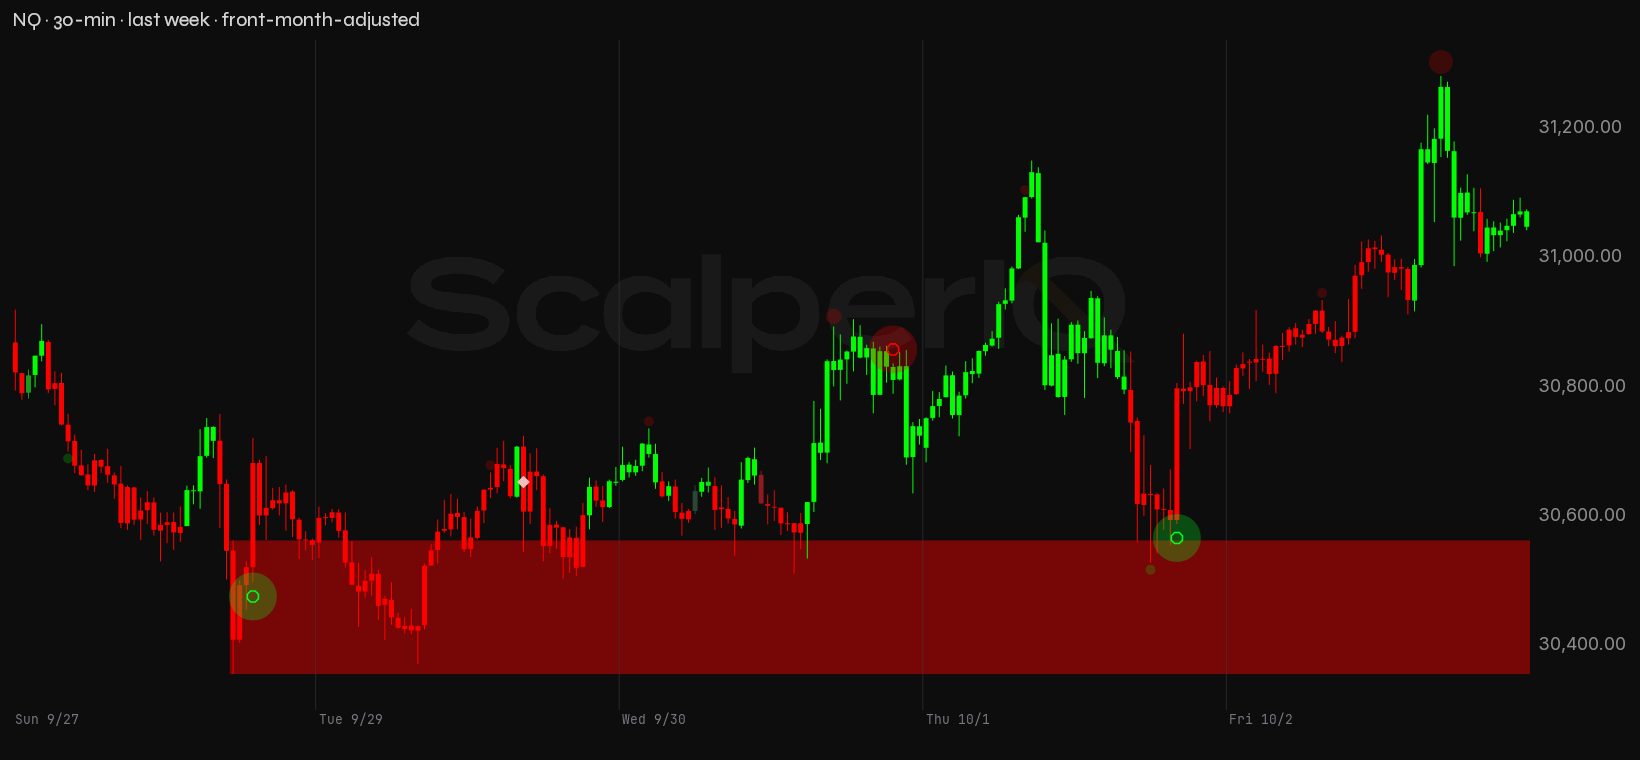
Coming into the week, the level that mattered on NQ was the 100% conviction offer shelf at 30,965, and the test was a hard one: a full session close above it on positive net delta, buyers lifting through that shelf rather than price drifting above it on thin flow. It never triggered. NQ spent the first three sessions grinding from 30,557 to 30,726 and didn't threaten 30,965 until Thursday's push to 31,151.50, and Thursday closed at 30,771.25 on −438 delta. The level finally broke on Friday when price closed at 31,049, but Friday's net delta was −5,231. The condition asked for buyers lifting the offer. What printed was sellers leaning on the bid while price went up anyway. The lines in the sand split: NQ's 29,904 held comfortably, while ES lost 7,707.25, with the week's low of 7,672.75 pushing through it before the tape recovered.
Here's ES's week on the same 30-minute chart, with the order flow marked up:
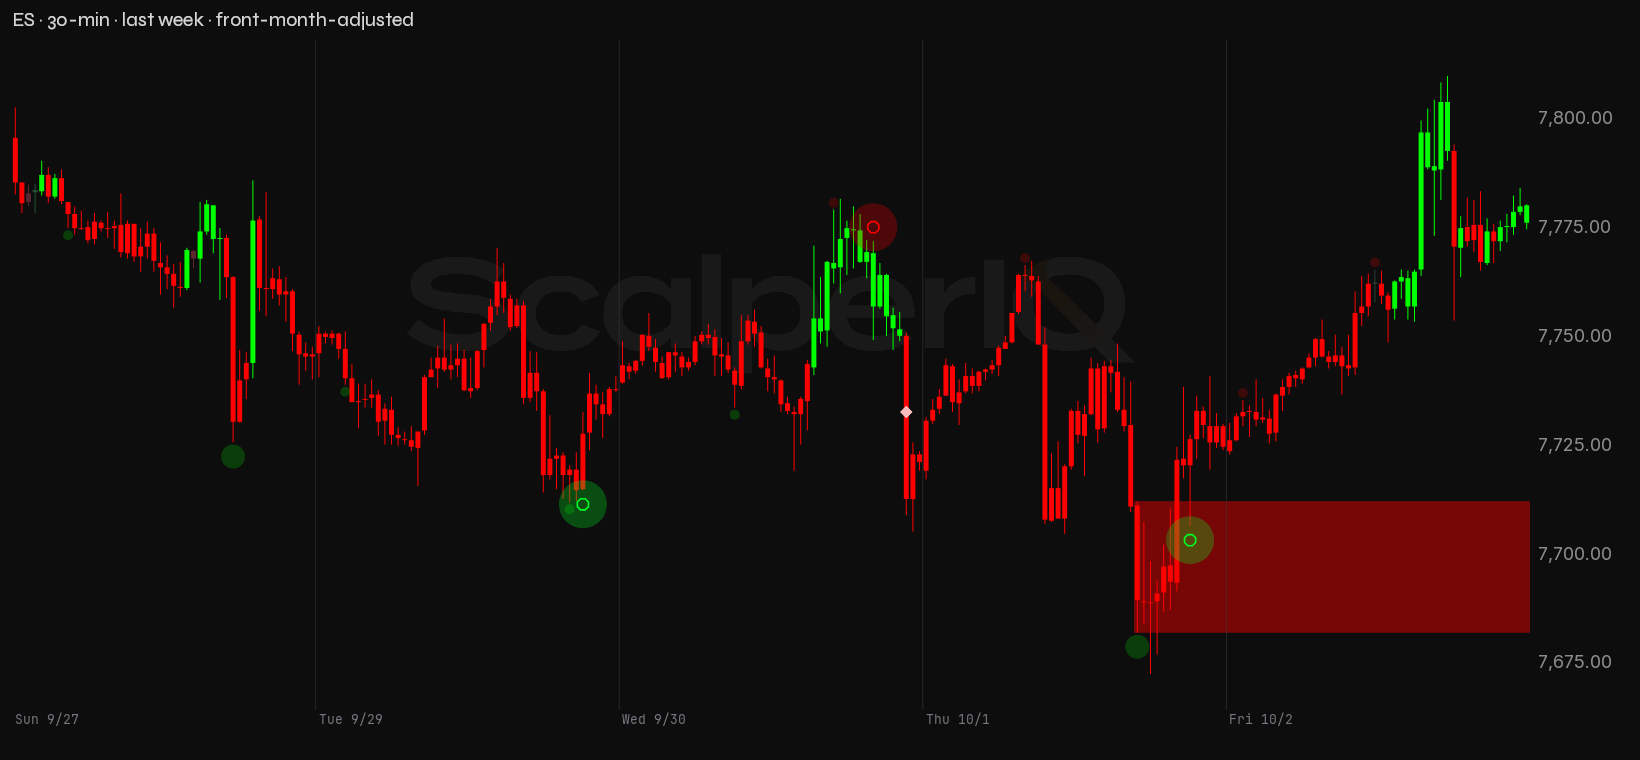
Quick version: NQ closed the week higher and ES closed it lower, but the order flow behind NQ's Friday push is the thing that matters most heading into October. Price printed the week's best close; delta printed the week's worst session.
September Ended With NQ's POC 1,309 Points Below the Close and a Cumulative Delta That Never Confirmed the Move
September's cumulative delta picture is almost flat. NQ finished the month at +3,059, a number that looks constructive until you put it next to the 2,041.75-point range the contract traded across the month. ES ran a larger +25,930, but its final week alone swung from +15,946 on Tuesday to −20,632 on Wednesday. With single sessions that size inside it, the monthly total is a noisy read, not a conviction lean.
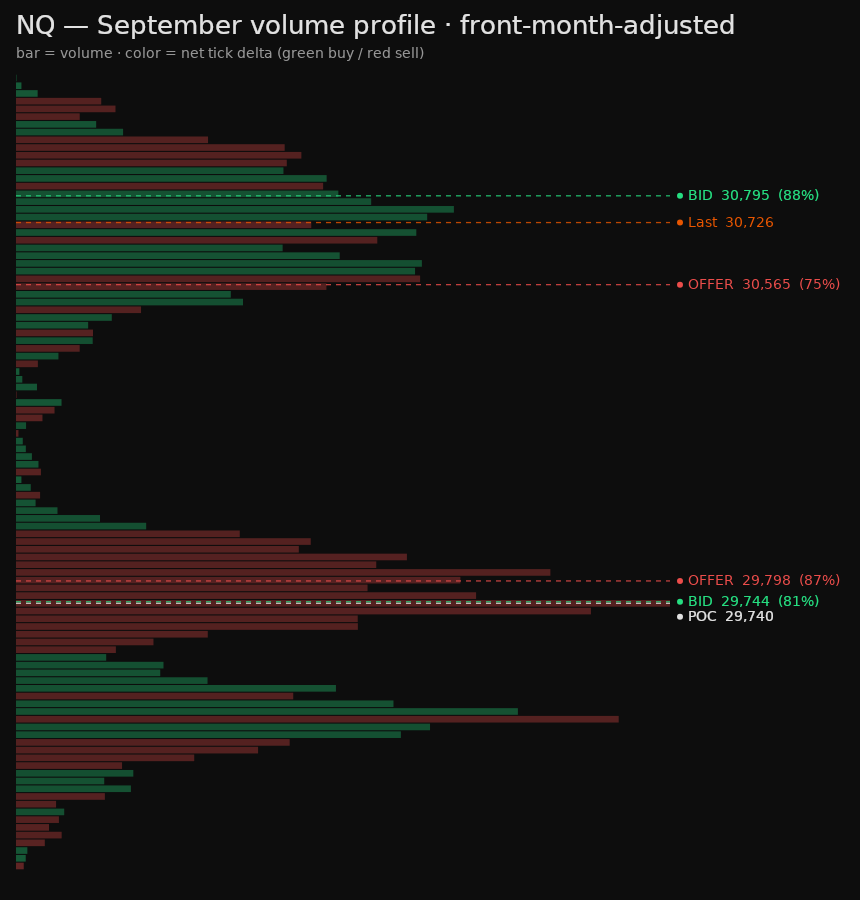
The NQ monthly profile tells the story plainly. The point of control printed at 29,740, 1,309 points below Friday's close of 31,049. NQ did its heaviest trade around that POC and then ran hard late in the month, leaving the profile bottom-heavy. Thin volume at the top and fat volume well below means the current price is not where the month did its business. It got there late.
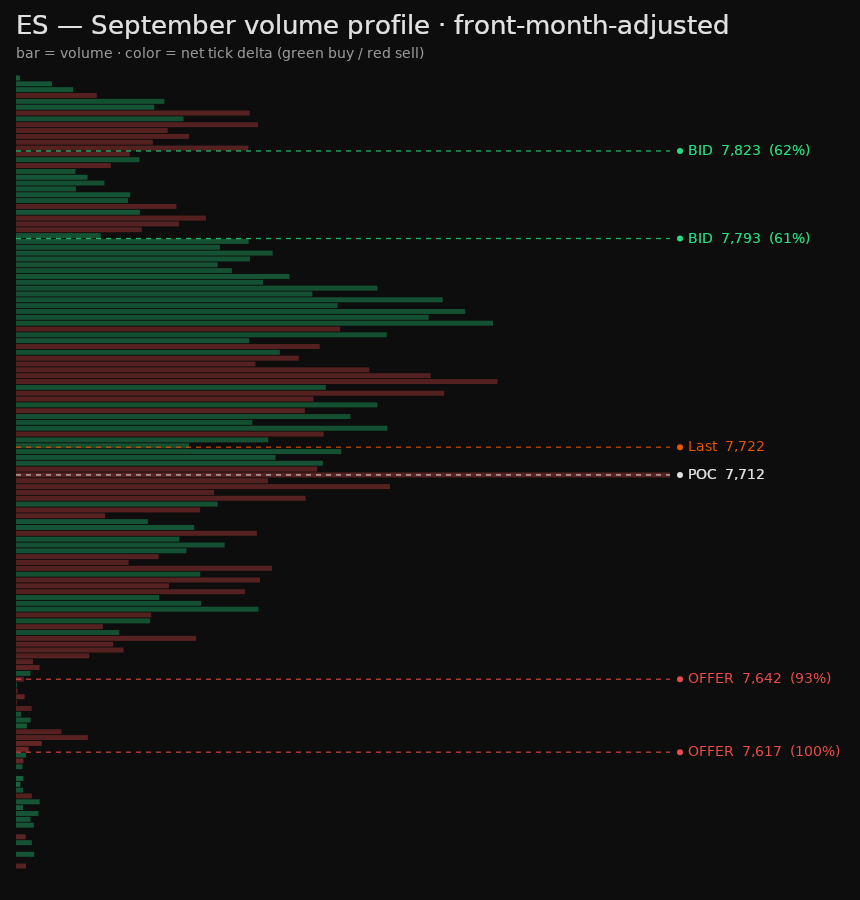
ES's monthly POC at 7,712 sits 65 points below Friday's close of 7,776.50, a much tighter gap than NQ's. The profile is more evenly distributed, which fits the session-to-session chop in ES's flow: the month's center of gravity stayed closer to where price finished. The asymmetry between the two is worth noting. NQ's profile is stretched and ES's is not, and that usually means one of them is running ahead of where the flow supports it.
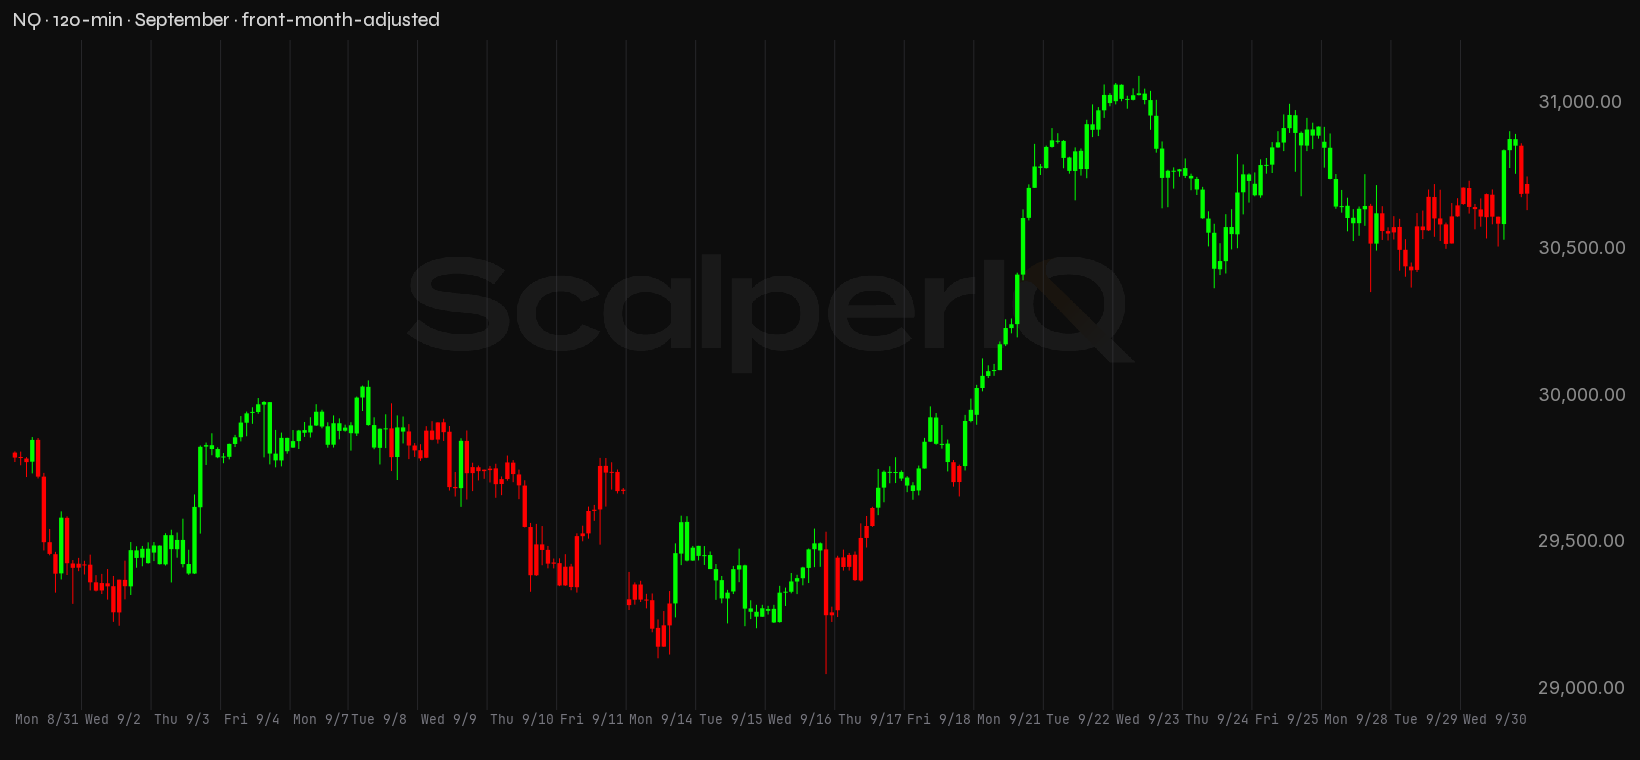
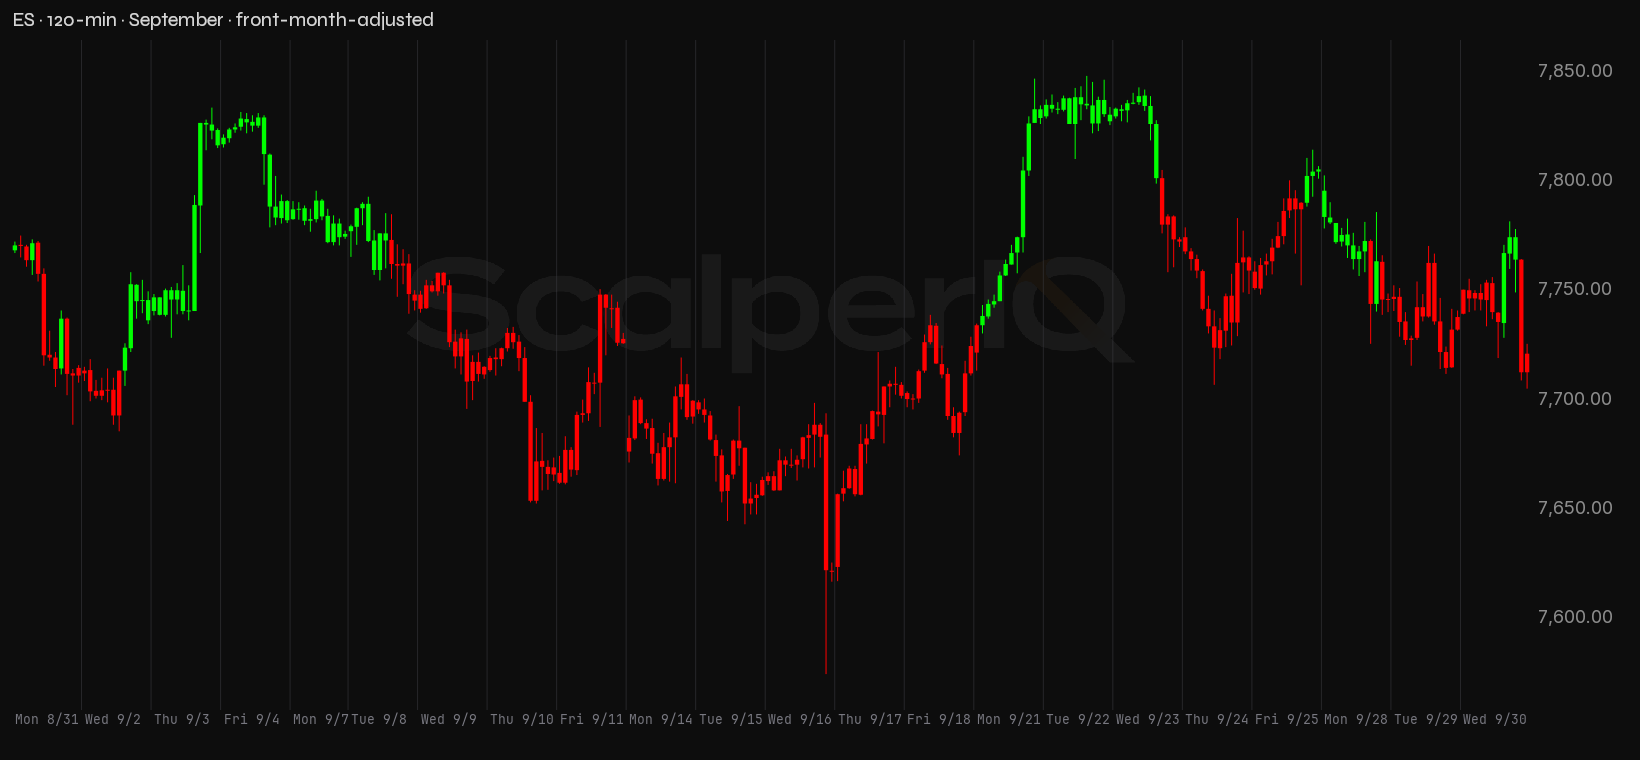
Both instruments printed a neutral weekly bias, and that's the honest summary of the month too: price moved and the profile shifted, but cumulative delta never built the kind of sustained lean that would call this accumulation. September's order flow was a wash with a late price surge on top of it.
Last Week, Up Close
Monday, September 28 was the week's most deceptive session on NQ and the most straightforward on ES. NQ opened at 30,870, dropped to a low of 30,356.75, and closed at 30,556.75, down 313.25 points on the session. But the net delta was +4,870. Aggressive buyers kept lifting offers all the way down and passive supply absorbed all of it: the order flow leaned to the buy side while price fell. ES told the opposite story that same day. It closed down 49.75 points on −1,524 delta, the smaller of its two negative sessions but a clean one, with sellers and price moving together.
Tuesday and Wednesday on NQ were quieter, both sessions closing modestly higher on positive delta (+2,507 and +1,858). The moves were small, 92.25 and 68.50 points, and the delta shrank each day: buying conviction was fading even as price inched up. ES on Tuesday printed its biggest positive delta of the week, +15,946, on a session that closed down 8.25 points. Nearly sixteen thousand contracts of net buying and price went nowhere. That is absorption. Somebody was selling into every lift, and the session closed in the lower half of its range.
Wednesday, September 30 was ES's most telling session. Price opened at 7,739.75, pushed to 7,782, and then closed at 7,721.50, down 18.25 points on −20,632 delta, the week's largest print by a wide margin on either instrument. Once the push stalled, sellers ran the session, and the 60.50-point fade off the high confirmed it. Wednesday, together with Monday's 59.50-point drop, is why ES finished the week down 29.25 points from the prior close even as NQ added 127.25.
Thursday and Friday flipped the script, and not cleanly. NQ closed Thursday up 64.25 points on −438 delta and Friday up 277.75 points on −5,231 delta. Three positive-delta sessions early in the week, two negative ones to close it out, and the most negative of them, Friday, was the session where price went up the most. Friday was NQ's largest delta session of the week, the same session that printed the week's high of 31,282.50 and closed at 31,049. ES closed both Thursday and Friday higher (up 5.50 and 52.50 points) on positive delta (+11,040 and +8,912), so the two instruments were not telling the same story on the back half of the week. ES's buyers were showing up; NQ's were not.
Levels I'm Watching
These levels come from measured order flow — where the tape actually concentrated buying or selling pressure, not lines drawn at round numbers or prior highs. The first time I use the word conviction* below, it refers to how one-sided the order flow was at that specific price, not to volume or strength in the conventional sense.
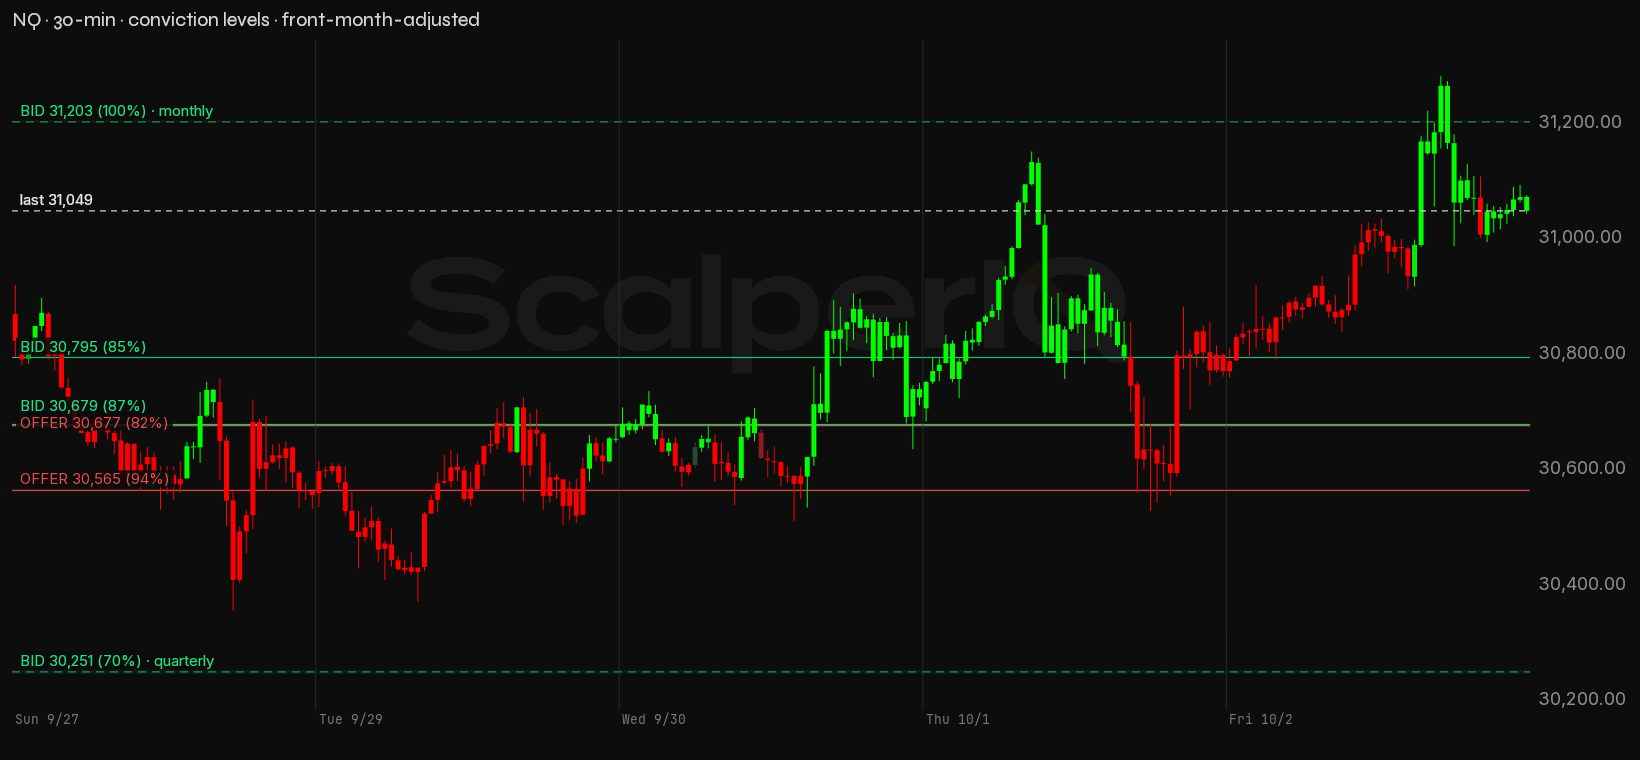
Here's NQ's full level set with the conviction table:
NQ conviction zones
| Zone | Price | Read |
|---|---|---|
| Re-offer | 30,677 (30,677–30,679) | Supply shelf — 82% conviction. |
| Re-offer | 30,565 (30,565–30,566) | Supply shelf — 94% conviction. |
| Bid (monthly) | 31,203 (31,202–31,205) | Demand cluster — 100% conviction. |
| Bid | 30,795 (30,794–30,797) | Demand cluster — 85% conviction. |
| Bid | 30,679 (30,679–30,681) | Demand cluster — 87% conviction. |
| Bid (quarterly) | 30,251 (30,247–30,254) | Demand cluster — 70% conviction. |
| Line in the sand | 30,357 | Last week's low — losing it is where I'd step back and reassess the bounce. |
NQ has one level above the close and five below it. The level above is the monthly bid shelf at 31,203, 154 points up at 100% conviction*: demand sitting right overhead. It is the first thing price runs into on any push higher, and the most one-sided print in the entire set. Below the close, the nearest level is the weekly bid shelf at 30,795, 254 points down. That is demand, not supply, so a pullback into it is a test of whether buyers defend it. Below that, the 30,677–30,679 band holds both a weekly offer shelf at 82% conviction (supply) and a weekly bid shelf at 87% (demand) within two points of each other, a compressed zone where both sides of the book are stacked on top of one another. Further down, the quarterly bid shelf at 30,251 carries 70% conviction, 798 points below the close.
The structure on NQ is unusual: both the nearest level above and the nearest level below are demand. There is no mapped supply between 30,795 and 31,203, so price is sitting in a 408-point corridor with bid-side order flow on both sides of it. The tape has not built an offer shelf in this range yet. The 30,565 weekly offer shelf at 94% conviction sits 484 points below the close, supply that price has already traded back above.
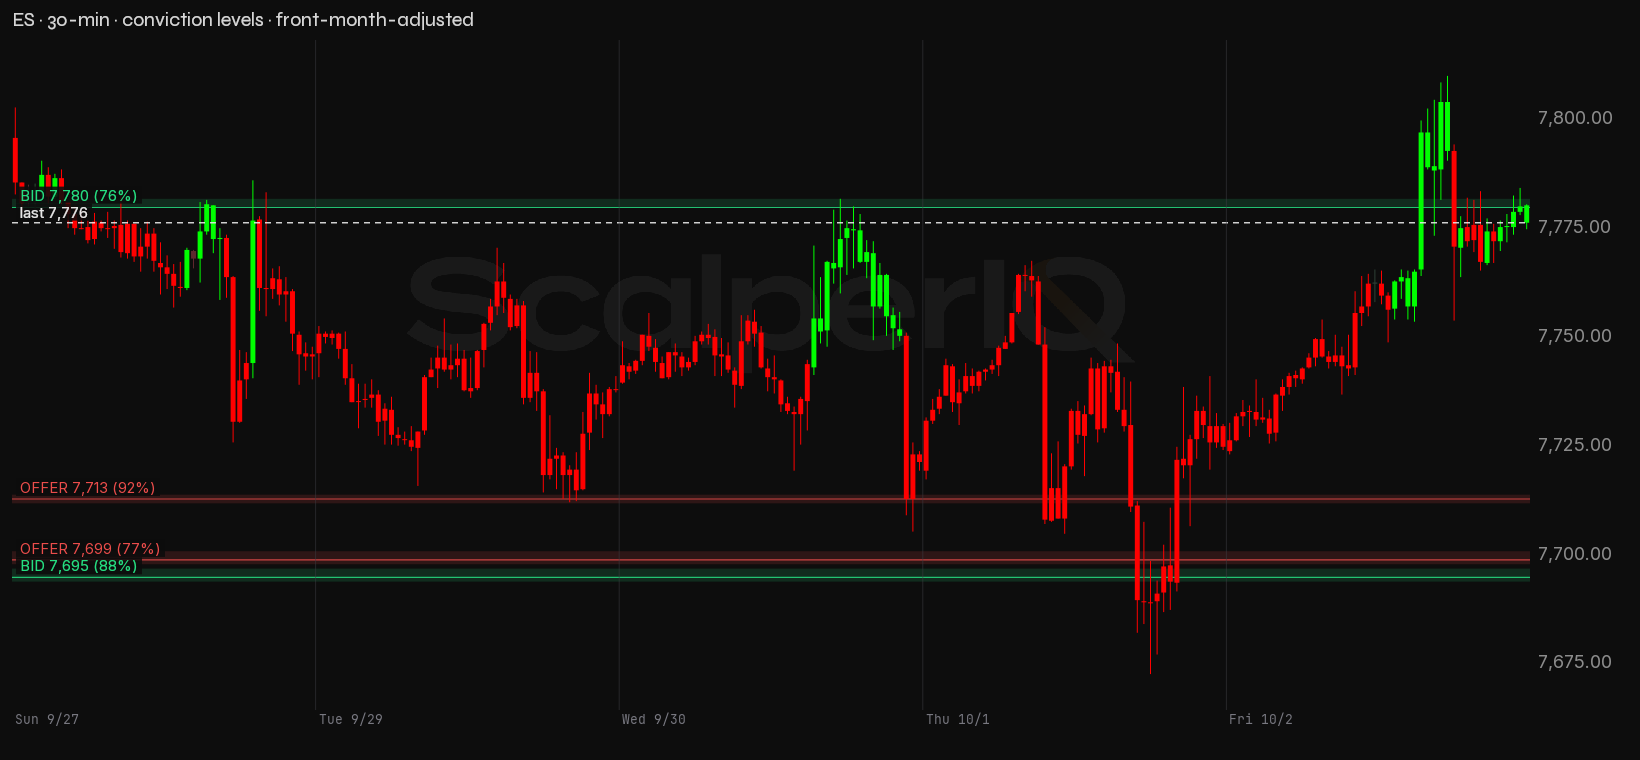
Here's ES's level set:
ES conviction zones
| Zone | Price | Read |
|---|---|---|
| Re-offer | 7,713 (7,712–7,714) | Supply shelf — 92% conviction. |
| Re-offer | 7,699 (7,698–7,701) | Supply shelf — 77% conviction. |
| Bid | 7,780 (7,780–7,782) | Demand cluster — 76% conviction. |
| Bid | 7,695 (7,694–7,697) | Demand cluster — 88% conviction. |
| Line in the sand | 7,673 | Last week's low — losing it is where I'd step back and reassess the bounce. |
ES has one level above the close and three below it. The level above is the weekly bid shelf at 7,780, just 4 points up: demand sitting almost exactly at the close of 7,776.50. Below the close, the first level is the weekly offer shelf at 7,713, 64 points down. That is supply, not demand, so a pullback through it would put price back in a zone where sellers previously controlled the flow. The 7,699 offer shelf at 77% conviction sits 78 points below, and the 7,695 bid shelf at 88% conviction is 81 points below, another compressed zone where supply and demand are stacked within a few points of each other.
The ES structure is tighter and more ambiguous than NQ's. The close is sandwiched between a bid shelf 4 points above and a supply cluster starting 64 points below. The single condition that resolves it most cleanly: ES holding above 7,780 on a session where net delta stays positive, buyers defending that bid shelf rather than price slipping back through it on the first test.
On the Calendar
One print on the calendar for the week of October 5. It's a thin week for data, but this one lands at a time that moves markets.
- Thursday, October 8 — Initial Jobless Claims, 8:30 AM ET. Most weeks this print is background noise, but an elevated reading can stir near-term volatility, and the tape thins into 8:30 reliably enough that the first spike off the number is rarely the real signal. Watch where delta settles in the 15–20 minutes after.
No CME holidays in the week ahead.
Bottom Line
The weight of evidence this week sits in the divergence, not the direction. NQ closed the week 127.25 points higher, but the session that did the most work to the upside, Friday, was the one where sellers leaned hardest on the bid. ES closed the week down 29.25 points, with its biggest delta session (−20,632 on Wednesday) pointing clearly lower while NQ was still grinding up. The two instruments ran different tapes in the final week of September, and that week sharpened the split rather than resolving it.
NQ, bull case: Price gets back to the monthly bid shelf at 31,203 and the buyers who owned that price show up again: lifting flow there on positive delta, and a session that holds above it. That is the 100% conviction demand level doing its job. Price tagging 31,203 and fading on negative delta would say that demand is spent.
NQ, bear case: Friday's −5,231 delta is the tell. NQ printed the week's high and its best close while sellers ran the most aggressive flow of its week. If the selling continues into the week of October 5, and particularly if the 30,795 weekly bid shelf at 85% conviction gives way on rising sell delta, the late-September push starts to look like distribution into strength rather than a genuine breakout.
ES, bull case: The weekly bid shelf at 7,780 is 4 points above the close. If buyers defend it, with positive delta and price holding above 7,780, the month's +25,930 cumulative delta gets a cleaner narrative and the prior week's close of 7,805.75 becomes the target.
ES, bear case: Wednesday's −20,632 session is not noise. The monthly POC at 7,712 sits right on the 7,713 offer shelf, and the 7,713–7,699 supply cluster starts 64 points below the close. A session that breaks back through 7,713 on rising sell delta would confirm Wednesday was the real read and Friday's recovery was short covering.
The two instruments disagree on what the week meant, and that disagreement is the most useful thing on the page. NQ has demand on both sides of the close with no mapped supply in the immediate range. ES is pinned between a bid shelf 4 points above and a supply cluster starting 64 points below, and with less room to stay ambiguous, it should resolve first.
* Conviction % — how one-sided the order flow was at that price. 100% means it traded essentially one direction; 50% means buyers and sellers fought it to a draw. It's a read on agreement, not size — a decisive level can still be a thin one.
* Delta means raw tick delta — executed buy volume minus sell volume, straight off the tape.
* NQ / ES are the full-size E-mini Nasdaq-100 and S&P 500 futures. We read the full-size contracts because that's where the institutional order flow trades; the delta and volume figures here are full-size contract counts. If you trade the micros (MNQ / MES), the price levels map across one-for-one — they track the same index.
Delta Reads are my own read of the order flow — informational only, not financial advice and not a recommendation to buy or sell anything. Trading futures is not suitable for all persons: it carries a substantial risk of loss, and you can lose more than your initial investment. This is my interpretation of the data and it can contain errors — in the data, in the analysis, or both. Do your own due diligence and trade your own plan.

Get the Delta Reads
Our weekly order-flow read on MES and MNQ — what the tape did, and the levels we're watching next. One email a week. No noise.
See what ScalperIQ looks like on a live chart.
Try Free for 14 DaysNo credit card required in the US (outside the US, a card is required to start). Available on MotiveWave, EdgeProX, and NinjaTrader.