Date:
Dec 23, 2025
Category:
Education
What is Order Flow Trading? A Practical Introduction for Futures Traders

Today I'm going to give you a brief introduction to order flow trading - a type of trading analysis that has gained traction in recent years. There are a few places you may have heard the term order flow:
Bookmap was founded in 2015 and is still one of the more well known and popular tools for visualizing orders, large trades, in a heat-map like format.
Rithmic was founded in the early 2000s, but has become the default data feed for many futures prop firms in recent years. It is a type of market data feed that shows the entire order book, every contract, at every level, both near and far from current price.
The run up in GameStop and AMC in recent years raised speculation that large trading firms like Citadel, sold order flow information to the highest bidder, supposedly using the information to gain an edge. While this speculation popularized the term order flow, this is not the type of order flow we'll speak to in this blog.
More examples exist, but we have gotten ahead of ourselves as I'm sure some of you are asking, what exactly is order flow trading and why has it become popularized?
Rather than give exact definitions, it's useful to group order flow into a few different categories. At its core, order flow trading refers to any type of trading where traders are predominantly focused on trading volume. If you're making trading decisions based on the number of participants involved (or not involved) and their behavior then you're order flow trading. Order flow trading is focused on the behavior of participants, how much volume they're transacting with, where that volume is transacting, and attempting to trade based on this information.
Common Forms of Order Flow Analysis:
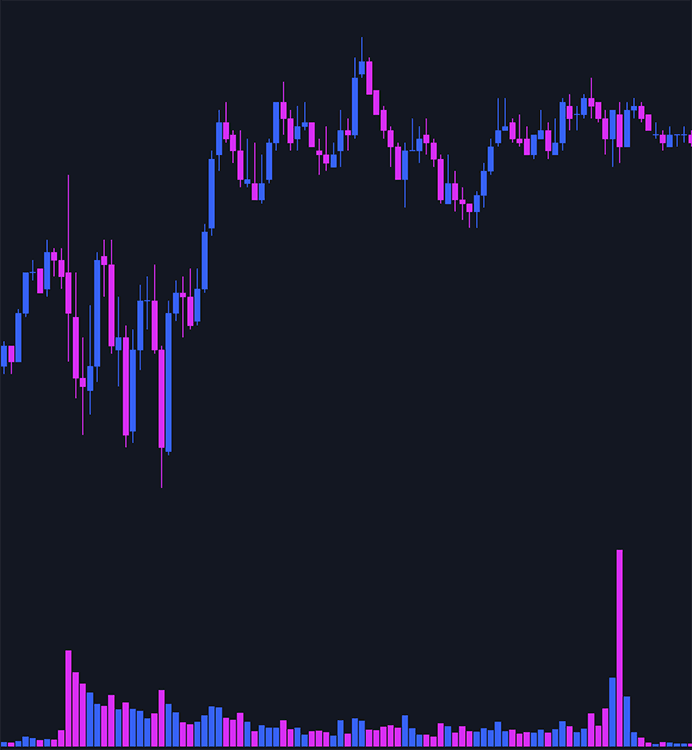
Basic Volume Analysis: This can be done without any special tools. As price moves up, is volume rising or falling? Is volume higher as we break out, or is it low as we pull back? This is simple analysis that can be done just by adding a volume study to your chart.
Volume Analysis by Price: This can be done with tools like volume profile and delta profile. Instead of showing volume as a simple up and down bar like in the above chart, these tools analyze volume at a specific price. The idea behind these tools comes from the concept of supply and demand. Areas where participants are interested in trading (value area) will have the majority of the volume while areas where participants are not interested in trading (out of value area) will have less volume.
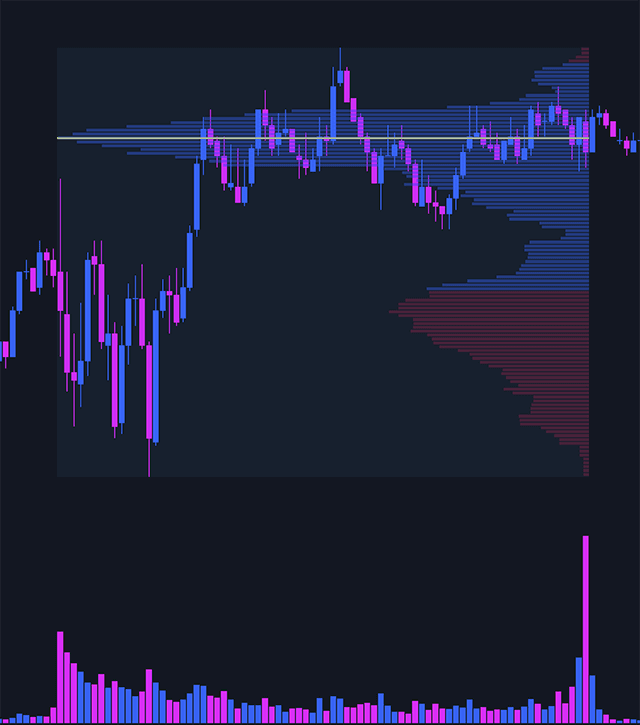
Volume Profile - Also known as volume by price.
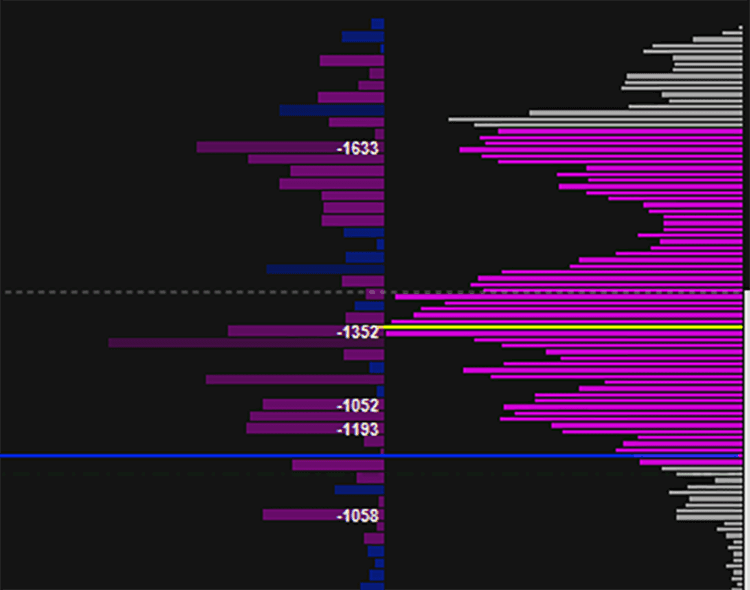
Delta Profile - Similar to volume profile, but instead of showing volume by price it shows delta (buying volume - selling volume) by price to analyze not only volume, but who was the most aggressive at specific price levels.
Footprint Charts: Footprint charts are an even further granular look at order flow. Think of footprint like a microscope on a specific candle. Basic volume analysis tells you that a candle had 3000 contracts of volume, volume profile shows you where the majority of the volume was done in that candle with a vertical graph, while footprint charts show you exactly how many contracts were traded at a specific price. The idea behind this is traders can find very specific price levels where lots of volume has been done, or buyers/sellers were extremely aggressive. These levels can be marked and highlighted for potential for support and resistance.
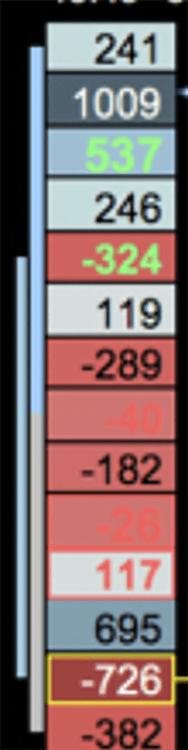
Footprint Chart - Candles can be analyzed to look at specific price levels for more detailed analysis. This particular one is looking at delta volume at each price level of the candle.
Each of these concepts could get its own blog series (maybe we'll do that at some point), but as an overview, I think of order flow trading as the analysis of participant behavior and making trading decisions based on that behavior. The market moves based on participant behavior - the core idea behind order flow trading is that this behavior is predictable, repeatable, and therefore tradable. I'll leave you with a couple hypothetical trading scenarios to illustrate this point:
Imagine a large entity is looking at S&P Futures and gives their traders the directive of "I want you to buy as much as you can near 6850. Any time price gets there I want you to buy. If it gets above 6850, I want you to stop buying until it comes back." As the session progresses, price pushes above 6850 and now every time it comes back, it simply cannot get below it. A moving average isn't going to help you here, Bollinger Bands aren't helpful, MACD isn't much use here, but you're watching the market trade and it's very apparent there's something special about 6850. Order flow tools will help you visualize and quantify how special into a trading decision. Participant analysis + context = trading opportunity.
Now imagine price is moving fast, news has just dropped, the market is dropping fast. Price cuts through support level after support level, and price keeps accelerating. It's a falling knife, but you know somewhere there's going to be an incredible bounce, but where? As price accelerates, you watch your delta profile and suddenly see a panicked seller unload 1000 contracts a few ticks from the low. Price pauses, sellers are still selling aggressively, but now they're not getting anywhere. Now price starts to move up, late sellers realize they chased too far, and these sellers now become net buyers as they start to cover and price explodes upward. Participant analysis + context = trading opportunity.
Order flow trading is ultimately about participant behavior. When combined with context, that behavior can reveal meaningful trading opportunities. In the next article, I'll focus on volume extremes and how they can be used for short-term trading opportunities.
Author

Zack
Lead Developer

