
OVERVIEW
ScalperIQ Delta Flow is a technical indicator designed for analyzing intraday order flow dynamics. It highlights changes in buying and selling pressure through the visualization of delta shifts, allowing traders to identify momentum reversals, absorption zones, and key transitions in market control. The tool provides structured visual data intended to support timely, informed decision-making.
This study is currently available for use on MotiveWave and EdgeProX platforms. Support for additional trading platforms is planned for future releases.
WHAT IS DELTA?
Delta measures the difference between aggressive market orders executed at the ask and bid prices. When more orders are executed at the ask, delta is positive, indicating buying pressure. Conversely, when more orders are executed at the bid, delta is negative, reflecting selling pressure. Delta analysis can help identify short-term imbalances and shifts in control between buyers and sellers.
HOW IT WORKS
ScalperIQ Delta Flow calculates bar-level delta values and visualizes them through candle coloring, delta pivot markers, and adaptive zone overlays. These elements reflect the intensity and direction of market aggression and provide insight into areas where sentiment may be shifting. All components are configurable to suit various styles of trading, with options to optimize both performance and visual clarity.
SCALPERIQ PORTAL
The ScalperIQ Portal is where users manage everything related to their ScalperIQ installation and license. You’ll use it to download the latest version of the app, retrieve your license key, or move your license to a new device. You can access it anytime at www.portal.scalperiq.com/portal or from the Portal link on the ScalperIQ website.
The portal provides a fast, self-service way to manage licenses and devices, ensuring users stay up and running with minimal friction.
HOW TO ACCESS THE PORTAL

Go to the Portal
Visit portal.scalperiq.com/portal or click the “Portal” link on the ScalperIQ website.Enter Your Email
Type your email address into the field and click Send Link.
You’ll receive a secure, one-time sign-in link that expires after 10 minutes.

3. Open the Secure Link
Check your inbox for an email from ScalperIQ titled “Your secure link to the ScalperIQ Portal.”
Click Open Portal to sign in instantly — no password required.

Moving Your License
Your ScalperIQ license is node-locked, meaning it can only be active on one computer at a time. Once your license file is placed in the Extensions folder and you open MotiveWave or EdgeProX, it automatically binds to that specific machine.
If you need to use ScalperIQ on another computer, follow these steps:
Close MotiveWave or EdgeProX on all machines.
Copy your license file to the Extensions folder on both computers or download it on the other machine from the portal.
Go to the ScalperIQ Portal and click Move License.
– This action unbinds your license from its current machine.Open MotiveWave or EdgeProX on the new computer.
– The license will automatically bind to that device, and the previous machine will be signed out.
You can move your license up to twice every 24 hours.
This system ensures you stay flexible while keeping your license secure and tied to your personal setup.
4. Manage Your Account
Once inside, your personalized dashboard will display several options:
Download ScalperIQ – Get the latest app version to place in your MotiveWave Extensions folder.
Download License – Retrieve your personal license key.
Move License – Reset your current device so you can activate on a new one.
Contact Support – Reach the ScalperIQ team for help with installation or licensing issues.
INSTALLATION
Currently, ScalperIQ is available for MotiveWave 6.9.12 and EdgeProX
Follow the steps below to install ScalperIQ on either Windows or macOS.
Before You Begin
Access the Portal:
Visit portal.scalperiq.com/portal and sign in using your email to receive a one-time secure link.Download Your Files:
Once inside the portal, download:
– Your ScalperIQ license file
– The ScalperIQ .jar fileYou’ll need to place both files in the appropriate Extensions folder for your platform.
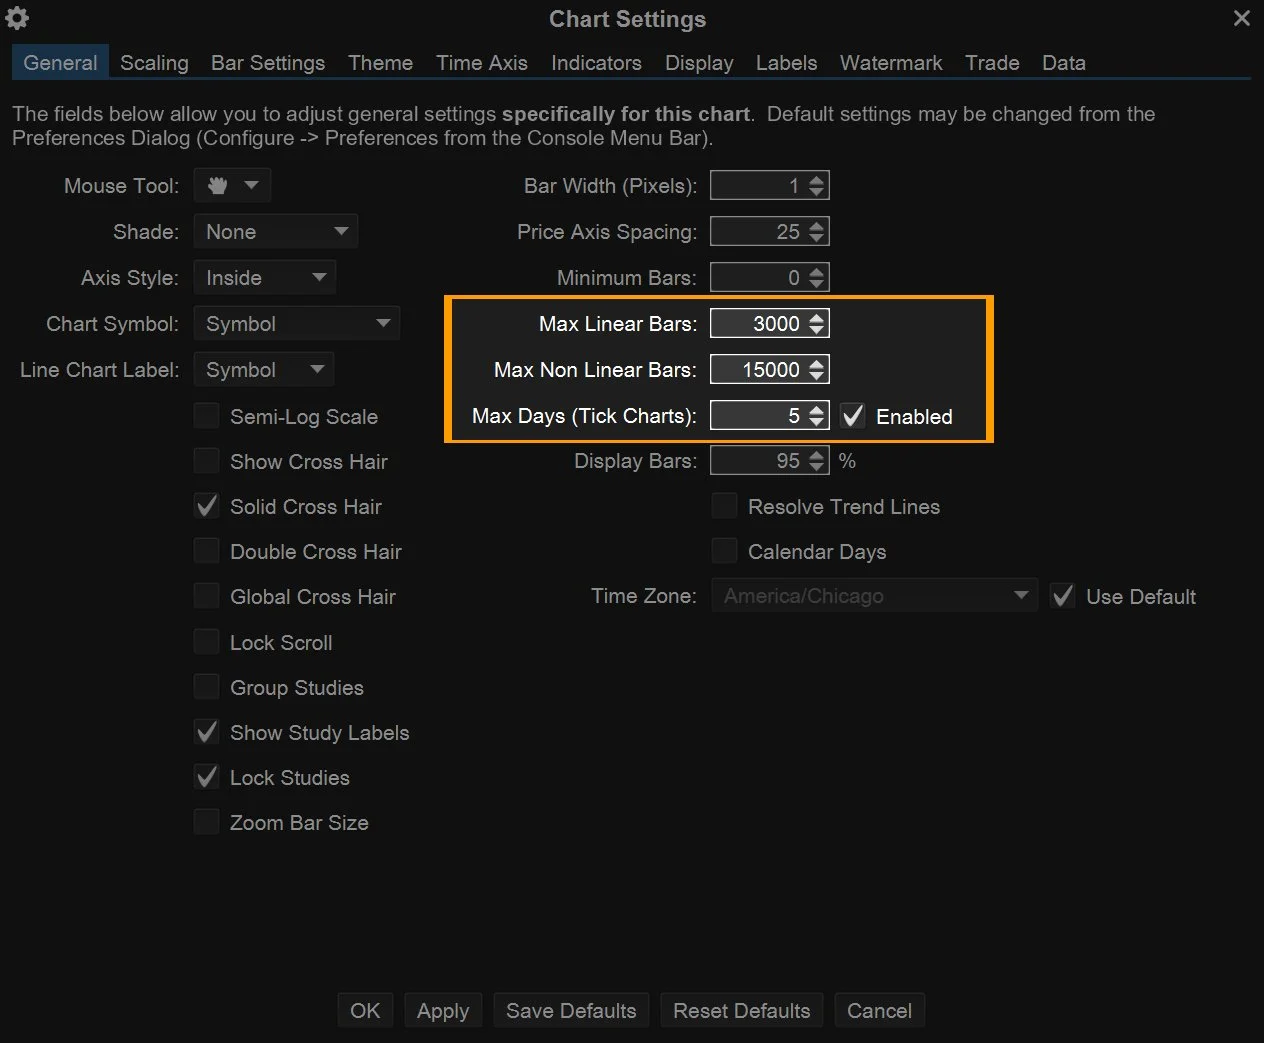
IMPORTANT. ScalperIQ has the ability to pull a vast amount of historical data. Before installing, we highly recommend reducing the # of linear and non-linear bars as well as days loaded for the chart you use it on to reduce load times and insure stability.
Follow the steps below to install ScalperIQ on either Windows or macOS
Installing on Windows
Close MotiveWave or EdgeProX
Make sure the platform is completely closed before starting the installation.Locate the Downloaded Files
Open your Downloads folder and find both the ScalperIQ .jar and license files you downloaded from the portal.Copy the Files
Right-click each file and select Copy from the context menu.Navigate to the Extensions Folder
Open File Explorer and go to:
C:\Users\[Your Username]\MotiveWave Extensions
or
C:\Users\[Your Username]\EdgeProX ExtensionsPaste the Files
Right-click inside the folder and select Paste.
Both the.jarfile and the license file should now appear inside the Extensions folder.Restart the Platform
Reopen MotiveWave or EdgeProX.
ScalperIQ should now appear under your studies list.
Installing on macOS
Close MotiveWave or EdgeProX
Make sure the platform is completely closed before starting the installation.Locate the Downloaded Files
Open Finder, go to your Downloads folder, and locate both the ScalperIQ .jar and license files.Copy the Files
Right-click (or Control + Click) each file and choose Copy.Navigate to the Extensions Folder
In Finder, open your main drive (Macintosh HD or equivalent), then go to:
Users → [Your Username] → MotiveWave Extensions
or
Users → [Your Username] → EdgeProX ExtensionsPaste the Files
Right-click (or Control + Click) inside the appropriate Extensions folder and select Paste.
You should now see both the.jarfile and the license file inside.Restart the Platform
Reopen MotiveWave or EdgeProX.
ScalperIQ will now appear in your studies list..

SETTINGS PANEL
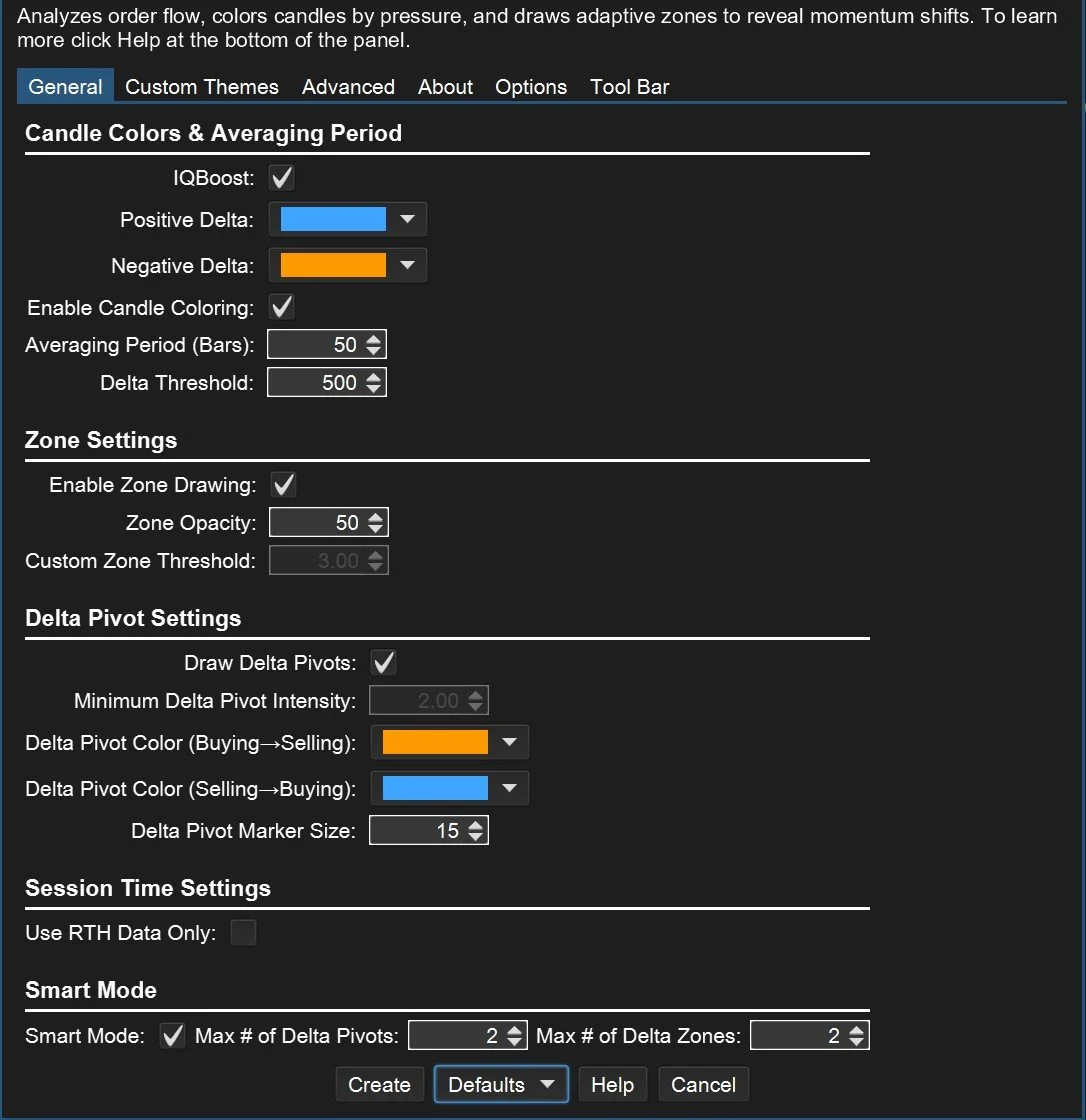
CANDLE COLORS & AVERAGING PERIOD
These parameters configure the core logic of delta measurement and visualization.
IQBoost: Enhances signal responsiveness by weighting price movement with delta intensity. This provides faster, more adaptive reactions to market shifts — though results may vary slightly between users due to local calculation differences.
Positive Delta Color: Defines the color used when delta is positive. This color represents buying aggression and may be overridden by the selected custom theme.
Negative Delta Color: Defines the color used when delta is negative. This represents selling aggression and may be overridden by the selected custom theme.
Enable Candle Coloring: When enabled, candles are color-coded based on the bar’s delta value. This highlights whether the bar exhibited net buying or selling aggression.
Averaging Period (Bars): Sets the number of bars used to calculate an average of delta. Short periods are more responsive, while longer periods reduce noise.
Delta Threshold: Influences how aggressively candles are colored. Candles are always rendered with some degree of color, but higher thresholds emphasize stronger delta values, while lower thresholds produce less of a gradient and a sharper split between buying and selling colors.

ZONE SETTINGS

Controls the rendering of delta zones—areas where notable buying or selling pressure has occurred.
Enable Zone Drawing: Toggles the display of delta zones on the chart.
Zone Opacity: Adjusts the transparency of the drawn zones.
Custom Zone Threshold: Sets a custom minimum threshold required to form a zone. Lower values produce more zones while higher values produce less.
DELTA PIVOT SETTINGS

Delta pivots indicate locations where buying and selling aggression has flipped with intensity. These are not trade signals, but rather objective markers showing potential shifts in control.
Draw Delta Pivots: Enables the display of delta pivot markers.
Minimum Delta Pivot Intensity: Sets the minimum delta deviation required to qualify a pivot.
Delta Pivot Color (Buying → Selling): Color used to mark transitions from buying to selling aggression.
Delta Pivot Color (Selling → Buying): Color used to mark transitions from selling to buying aggression.
Delta Pivot Marker Size: Controls the size of the pivot marker symbol.
SESSION TIME SETTINGS

Configures whether analysis is limited to Regular Trading Hours (RTH).
Use RTH Data Only: Restricts analysis to RTH if enabled; includes full-session data when disabled.
SMART MODE

In Smart Mode, Delta Zones and Delta Pivots are added and removed automatically based on their intensity values. This mode is for traders who prefer tweaking less settings and having a less cluttered chart. If a Delta Zone or Delta Pivot disappears during a trading session when Smart Mode is enabled it is because a newer zone or pivot is stronger than a previous one. Smart Mode is useful in high-frequency environments where too many signals may obscure meaningful activity.
Max # of Delta Pivots: Sets the upper limit of pivot markers per session.
Max # of Delta Zones: Caps the number of delta zones drawn per session.
ADVANCED SETTINGS

Provides options to extend zone behavior across sessions and preserve historical visuals.
Invert Zone Colors: Invert your zone colors so that buy zones appear as a sell color and sell colors a buy. This is a visual change only - the zones are still created by aggressive buying or selling.
Extend Zones Across Sessions: Allows delta zones to persist beyond the session in which they were formed.
Preserve Historical Zones in Smart Mode: Retains previously drawn zones when Smart Mode is active. To keep charts from being too cluttered, it is recommended to use this setting with a low Max Zone count. Zones will fade out over time to prevent the chart from becoming too cluttered when this setting is enabled.
First Session to Extend: Increasing this number will show you previous zones extended into the current session starting with zones from 1 (previous session).
Last Session to Extend: Increasing this number will cut out previous session zones. Matching First Session To Extend will only extend zones from that session. I.e. a setting of 3 in both will only extend zones from 3 sessions ago.
CUSTOM THEMES

Custom themes apply a consistent color scheme to candle and marker rendering. When enabled, manual customization of individual color parameters is disabled.
Use Custom Color Theme: Enables use of a predefined theme.
Bar Color Theme: Selects a theme from available options:
Super Hero
Classic
Sunset Glow
Electric Shock
Frostbite
Obsidian (for light colored chart backgrounds)
HOW TO INTERPRET SIGNALS
ScalperIQ Delta Flow highlights delta shifts that reflect underlying changes in order flow. Signals include color-coded candles, directional pivot markers, and adaptive delta zones.
CANDLE COLORS

Candles are colored based on delta values. This allows for quick visual assessment of whether a bar was dominated by buyers or sellers.
Positive Delta Candles: Reflect net buying pressure.
Negative Delta Candles: Reflect net selling pressure.
DELTA PIVOTS
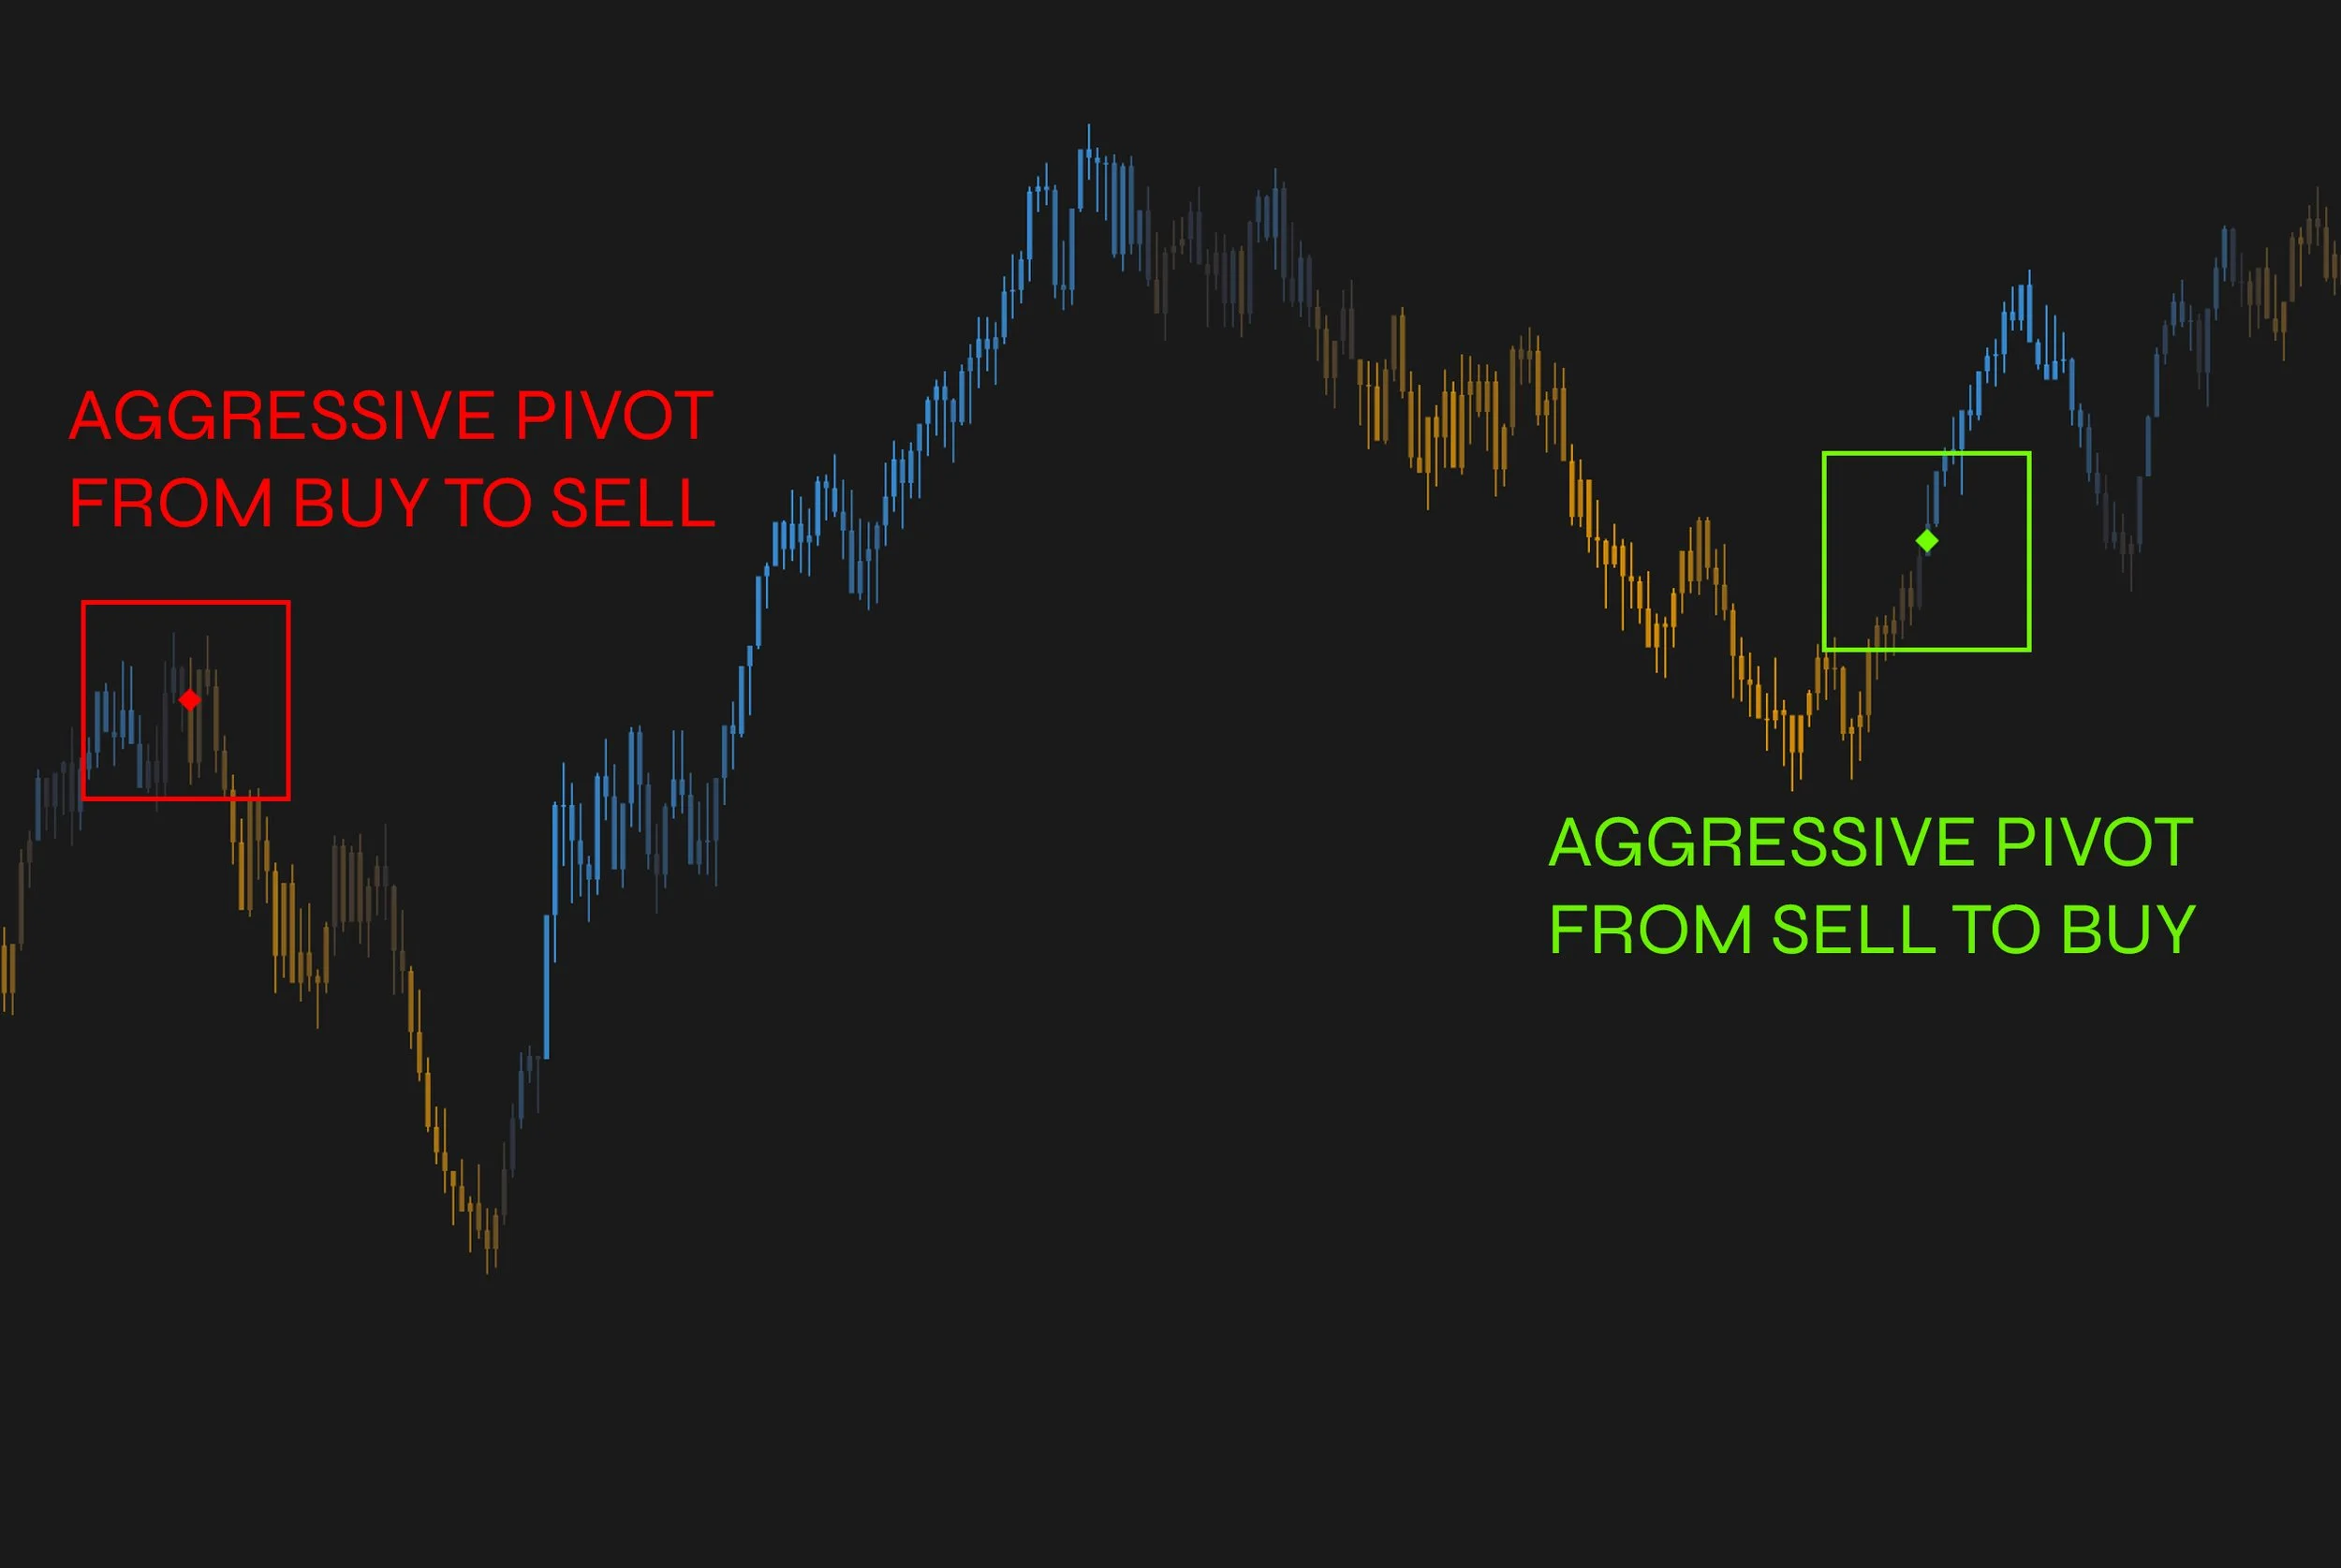
Delta pivots identify moments where aggressive market control changes hands. These are not entry or exit signals, but rather context markers to help traders assess the underlying order flow activity.
Buying to Selling Pivots: Indicates a dramatic shift from net buying to selling.
Selling to Buying Pivots: Indicates a dramatic shift from net selling to buying.
DELTA ZONES

Zones are drawn where delta intensity has reached a significant threshold. These zones often serve as areas of interest for potential support, resistance, or price reversion. It is important to note that when a zone formed from aggressive selling is later reclaimed by buyers (i.e., price moves above the zone), it may subsequently act as support, and vice versa for a buy zone reclaimed by sellers. These contextual shifts can offer additional insight into the evolving balance of market pressure.
ScalperIQ Delta Flow supports a variety of short-term and intraday strategies. The indicator is best used in conjunction with other price action or volume-based tools.
Trend Confirmation: Persistent delta alignment with price movement helps confirm trend direction. Strong positive delta in a rising market suggests sustained buyer control.
Reversal Awareness: Aggressive shifts in delta (e.g., through pivots) may precede price reversals. These shifts are especially relevant when they occur at technical levels or after exhaustion moves.
Entry Timing for Scalping: Scalpers may use delta pivots and high-intensity delta zones to identify precise moments of temporary imbalance that provide edge for short-duration trades.
Breakout Validation: Breakouts supported by strong directional delta are generally more reliable. Weak delta on a breakout may indicate a potential fakeout or lack of participation.
Support/Resistance Refinement: Delta zones allow for refined intraday support and resistance analysis based on aggressive order activity rather than static levels.
USE CASES
SUPPORTED BAR TYPES
ScalperIQ Delta Flow is designed to work with the following bar types:
Tick
Linear (up to 30 min time frame)**
Constant Volume
Range
Renko
Hybrid Renko
NT Renko
Point & Figure
Reversal
**Note that loading times for linear charts may be long. We recommend reducing the # of bars on your chart when using linear bars.
PLATFORM SUPPORT
ScalperIQ Delta Flow is currently available for use on the MotiveWave and EdgeProX platforms. If you have platform-specific questions unrelated to ScalperIQ regarding installation, chart settings, or general usage, please refer to the respective platform documentation:
MotiveWave Official Website: https://motivewave.com/
MotiveWave Documentation: https://docs.motivewave.com/
EdgeProX Official Website: https://edgeclear.com/
Support for additional trading platforms is planned for future releases.
Why do positive delta candles sometimes appear in a downtrend, or negative delta candles in an uptrend?
This is due to the Averaging Period setting. A higher averaging period smooths out fluctuations, making delta values more stable but slower to react to changes. This can result in positive delta appearing even as price declines, or negative delta showing up as price rises. In contrast, a lower averaging period reacts more quickly to recent order flow changes but may introduce more noise. Traders should adjust this setting based on their preference for signal stability versus sensitivity and their chosen trading time frame.
I input my license key, but none of my candles are colored, and I don't see any markers or zones.
If your study is not displaying any visual elements after entering the license key, try the following troubleshooting steps:
Toggle a Setting: Adjust any setting within the study’s configuration panel and apply the changes to see if it resolves the issue.
Remove and Reapply the Study: Delete ScalperIQ Delta Flow from your chart and reapply it.
Verify Your License Key: Double-check that the license key was entered correctly without extra spaces or errors.
Restart the Platform: If the issue persists, restart MotiveWave or EdgeProX and reload the study.
Contact Us: If you’re still having trouble please email us at info@scalperIQ.com with “Troubleshooting” in the subject line.
Why do delta zones and delta pivots change position when I modify the averaging period?
Changes to the averaging period setting affect how delta values are processed and visualized. Modifying this input alters the context used to evaluate what qualifies as a significant delta shift. As a result, the placement or presence of delta zones and pivots will adjust accordingly. This is expected behavior and reflects the recalculation of data under the new configuration.
I have Smart Mode enabled and see less zones/delta pivots than in my max settings. Why?
The setting specifies the maximum number of pivots/zones that may be displayed. If fewer pivots/zones appear, it means fewer qualifying areas were detected than the max setting.
Why aren’t my candles changing color?
Ensure "Enable Candle Coloring" is active and that delta values exceed the threshold. If a custom theme is selected, individual color overrides will be disabled.
Why don’t I see delta pivots?
Confirm that "Draw Delta Pivots" is enabled and consider lowering the "Minimum Delta Pivot Intensity" to include more subtle shifts if not in Smart Mode.
How do I reduce chart clutter?
Enable Smart Mode and adjust the maximum number of pivots and zones to be displayed per session.
Why is the indicator running slowly?
ScalperIQ runs tick level calculations which can be intensive. To feel more responsive, reduce the # of bars on the chart using Chart Settings and reducing the Max Linear Bar/Max Non-Linear Bar count.
Can I use this during pre-market or extended hours?
Yes. To include all trading hours, uncheck "Use RTH Data Only."
When I turn RTH Data Only on or off, my markers and zones change positions. Why?
This occurs because the calculation for delta zones and pivots is based on the data available. When "Use RTH Data Only" is enabled, calculations are performed using only regular trading hours, excluding pre-market and after-hours data. When disabled, the full session is included, which can impact where zones and pivots appear.
Why do I see different signals than another user on the same asset and timeframe?
Tick data is inherently noisy and can vary slightly between users due to differences in data feed timing or how local data is stored. Complete synchronization between users may not always be possible, especially if one user’s chart has been running longer than another's.
However, differences in alignment do not reduce the accuracy of signals. The indicator is designed to adapt to incoming data consistently, meaning that even if two users see slight variations, the signals themselves remain reliable and relevant for each user's setup.
For all other questions please email info@scalperIQ.com